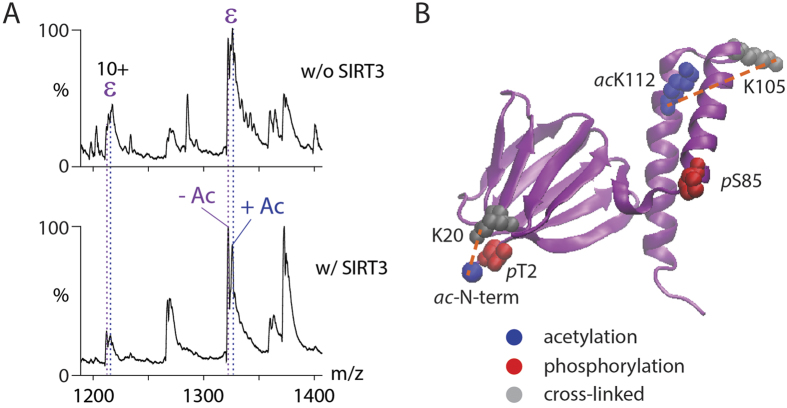
Figure 4. cATPase-ε is acetylated.
(A) Two populations of ε were observed in low m/z mass spectra: the acetylated (+Ac) and deacetylated (−Ac) ε subunit. Before SIRT3 deacetylase treatment approximately equal abundances were observed for the two populations (upper panel). After incubation with SIRT3, intensities for the unmodified population increased (lower panel). (B) A homology model of ε is shown23. Phosphorylated (red) and acetylated (blue) residues are shown (space fillings). Lysine residues that were cross-linked are shown (grey) and cross-links are highlighted (dotted lines).

