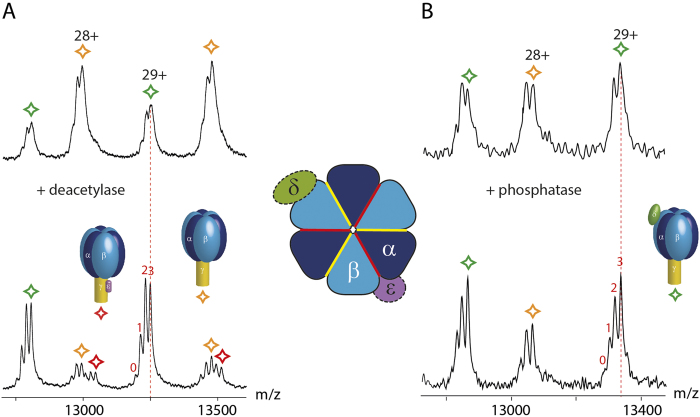
Figure 5. Nucleotide binding of cATPase is regulated by PTMs.
The untreated cATPase shows two populations with two or three nucleotides bound (upper panels). After deacetylation (A) and dephosphorylation (B) additional populations corresponding to cATPases with zero and one nucleotide bound are observed. Interestingly ε is retained following deacetylation, but not phosphorylation, consistent with cross-linking data and its extended form. Intensities of the peaks corresponding to two nucleotides bound increased, specifically in the case of the deacetylated complex. Panel (B) was modified from24.

