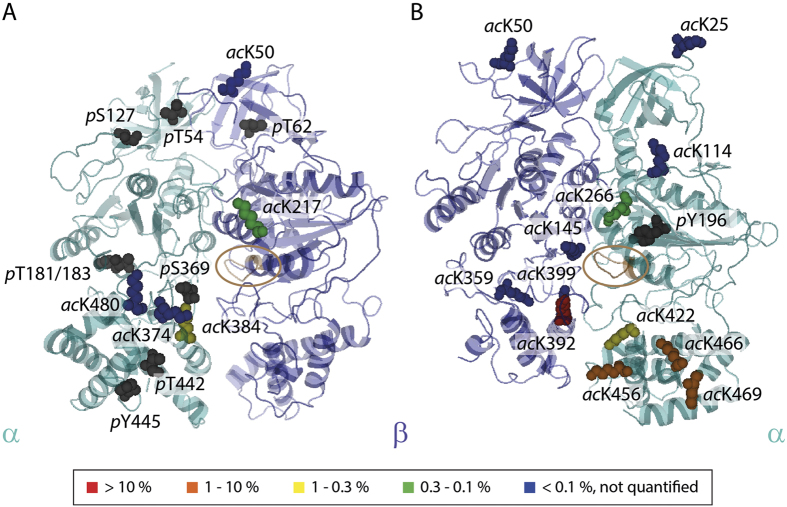
Figure 6. Protein interfaces in the catalytic center of the cATPase are regulated by PTMs.
Phosphorylation and acetylation sites are shown (space fillings) on the crystal structure of the cATPase α/β-head (PDB ID 1FX0). Acetylation sites are coloured according to their abundance (see heatmap). (A) The α/β-interface of the catalytic head is dominated by phosphorylation sites (grey). Acetylation sites are low abundant. (B) The majority of acetylation sites was identified in the β/α-interface. Abundant sites are located in the C-terminal domain important for nucleotide binding.

