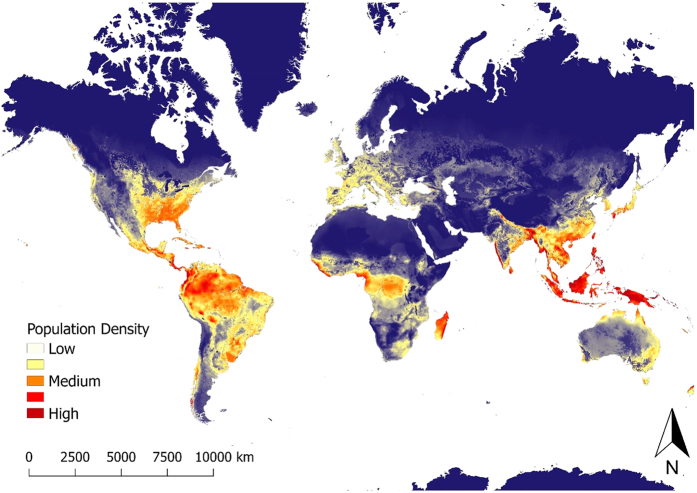
Figure 3. Map of predicted population density of wild pigs for habitat occurring across the world.
For terrestrial environments, areas of white represent low density (1 individual/km2), orange moderate density (6 individuals/km2), and dark red high density (≥11 individuals/km2). Maps were created using Google Earth Engine80 and QGIS 2.14.390. See Supplementary Figure S5 for finer scale maps of predicted population density of wild pigs for Europe, Asia, Africa, Australia, North America, and South America.

