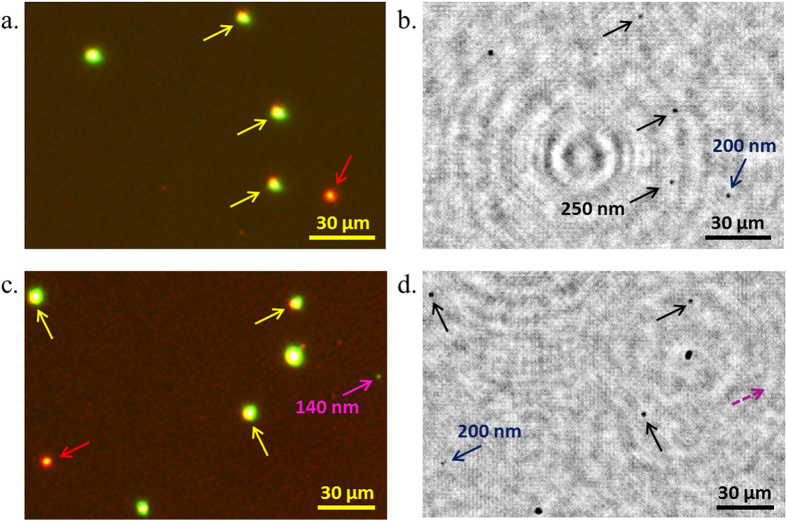
Figure 4.
(a) and (c) Fluorescence microscopy images of green-fluorescent 250-nm beads (yellow arrows), red-fluorescent 200-nm beads (red arrows) and a green-fluorescent 140-nm bead (purple arrow). (b) and (d) The corresponding amplitude reconstructions from the UV on-chip images with 250-nm beads (black arrows) and 200-nm beads (navy-blue arrows). The 140-nm bead is not visible in the amplitude reconstruction (dashed purple arrow).

