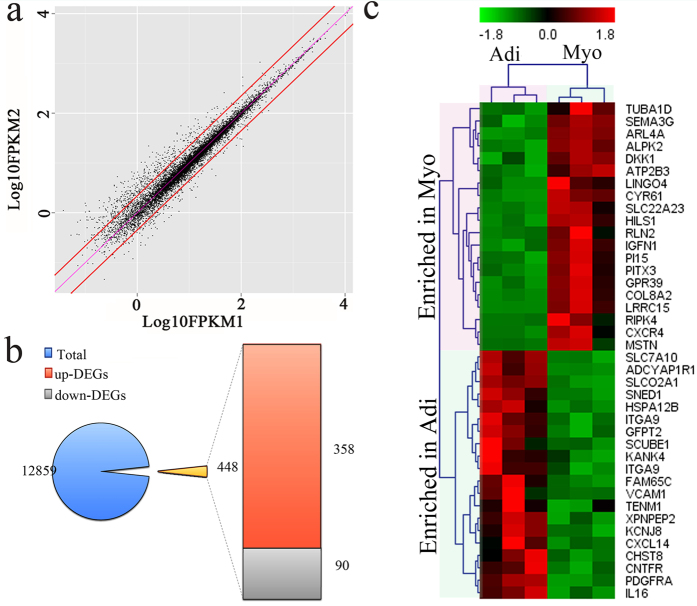
Figure 3. DEGs between adipogenic and myogenic cells based on the RNA-sequencing data.
(a) Genes were categorized into DEGs (plots that off the two red line) based on their position to the diagonal (FPKM1 represent adipogenic (Adi) cells, FPKM2 represent myogenic (Myo)). (b) Overview of DEGs numbers between adipogenic (Adi) and myogenic (Myo) cells. (c) Hierarchical clustering of top 40 DEGs (top 20 genes with either higher or lower expression in myogenic compared to adipogenic cells) between adipogenic (Adi) and myogenic (Myo) cells. The data of each type cells comes from three replicates. Heat-maps were generated by MeV (4.9.0).

