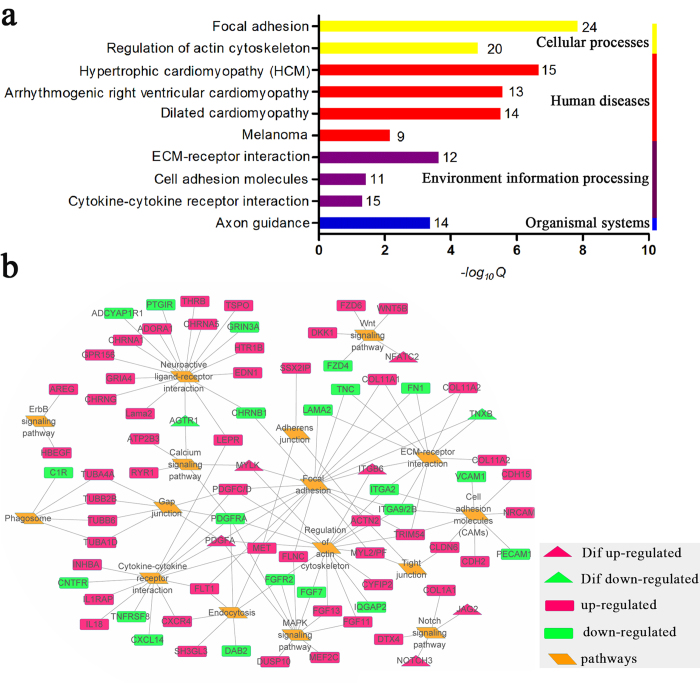
Figure 5. KEGG analysis of DEGs and their relationship with cell differentiation.
(a) Significantly enrichment pathways (q < 0.05) based on identified DEGs. (The number in the right of columns represented the number of DEGs that involved in those enrichment pathway). (b) Transcriptional regulatory network of DEGs in key KEGG pathways, which included by environmental information processing and cellular process. Diamonds represent KEGG pathways, rectangles represent genes involved in the KEGG pathways and the triangle represent DEGs related to cell differentiation. The colour of the nodes represents gene expression status (red means genes up-regulated in Myo, green means down-regulated in Myo). Networks were visualized by Cytoscape (v3.2.1).

