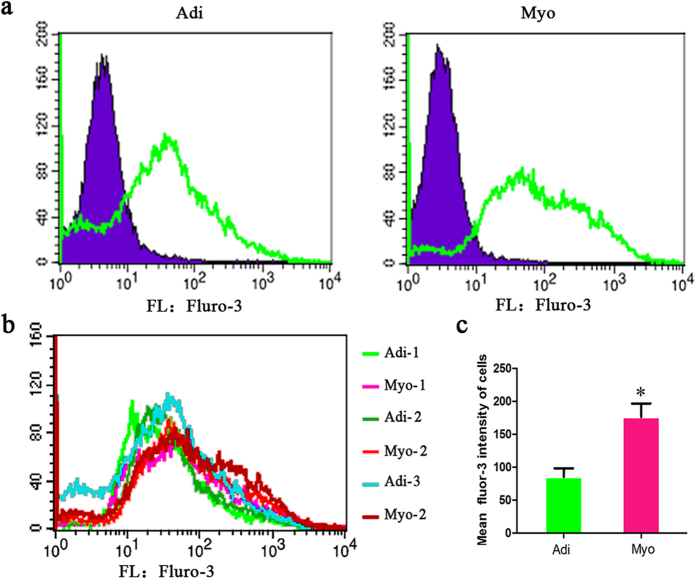
Figure 6. Intracellular calcium concentration differed in adipogenic and myogenic cells of porcine.
(a) Average Ca2+ signals of adipogenic (Adi) and myogenic cells (Myo) compared with unlabled control (the blue represented unlabled control, the green represented fluro-3 labled cell). (b) Average Ca2+ signals of adipogenic (Adi) and myogenic cells (Myo) from porcine skeletal muscle, the data of every group comes from three replicates. (c) Mean fluro-3 intensity of adipogenic (Adi) and myogenic cells (Myo) from porcine skeletal muscle, *significant difference between adipogenic (Adi) and myogenic cells (Myo) with p < 0.05.

