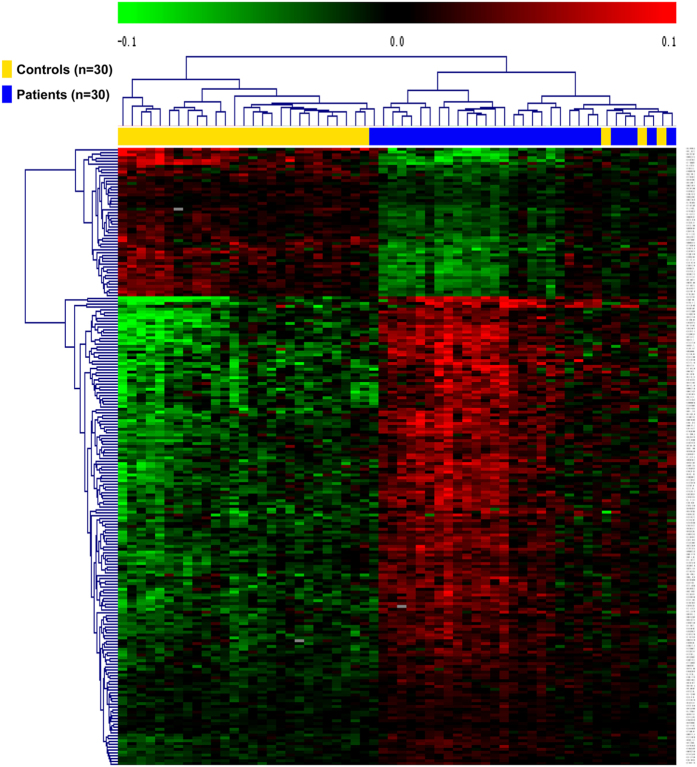
Figure 1. Heat map generated from clustering-analysis of microarray data illustrating differentially methylated DNA sites in blood whole genome in the mesial temporal lobe epilepsy (MTLE) patient group (n = 30) relative to the control group (n = 30) as indicated above the heat map.
Bead tags are listed vertically at the right side of the map. The extents of green and red represent levels of hyper-methylation, hypo-methylation, respectively, whereas black indicates no change in methylation, relative to control.

