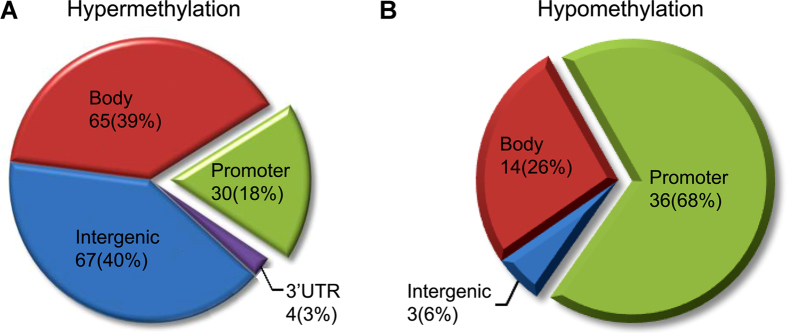
Figure 3. Pie graphs illustrating the rate distribution of differentially methylated DNA sites in mesial temporal lobe epilepsy in reference to genomic structure domains.
Percentage rates for the hyper-methylated and hypo-methylated sites associated with the promoter, coding (body), non-coding (intergenic) and the 3′ UTR regions are illustrated in (A) and (B), respectively.

