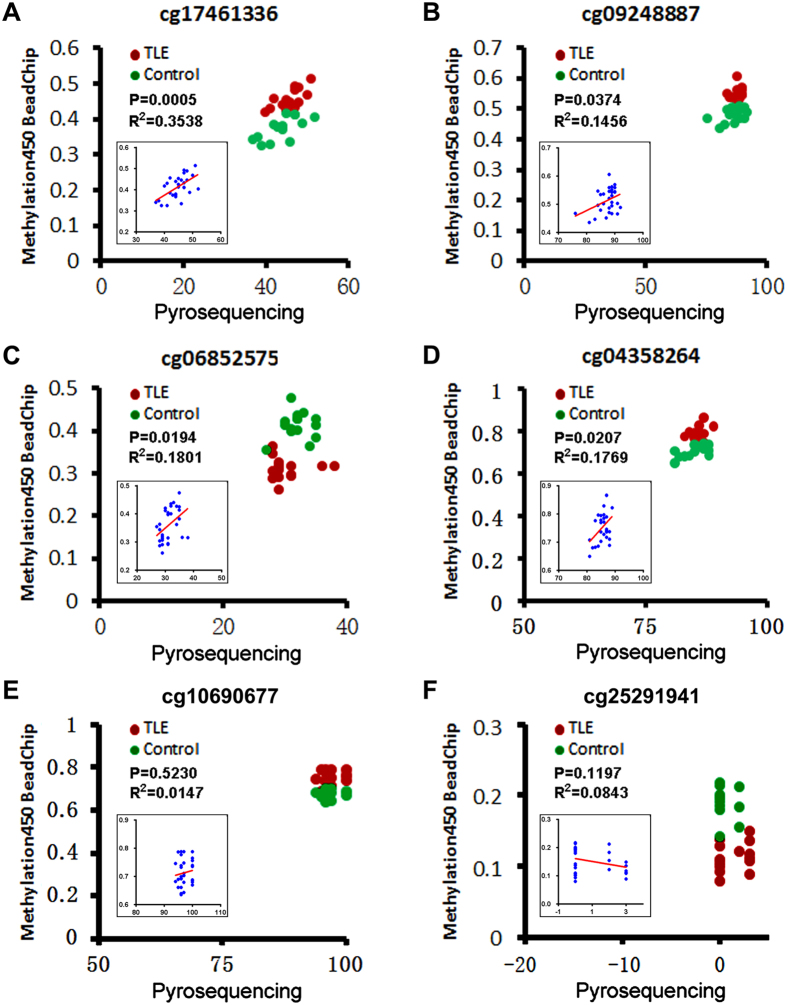
Figure 5. Cross-validation of DNA methylation with the pyrosequencing.
Shown are degrees pf methylation of six representative CpG loci reported by Methylation450 BeadChip (Y axis, ratio) and pyrosequencing (X axis, percentage) assays. Red and green dots in each panel plot values of methylation at a given site among individual patients (n = 15) with temporal lobe epilepsy (TLE) and controls (n = 15). Insert in the panel shows a correlation analysis between the two sets of values among individual cases regardless of subject groups, with P and R2 values labeled for each gene site. For cg17461336 (A), cg09248887 (B), cg06852575 (C) and cg04358264 (D), the degrees of methylation detected by the two methods were positively correlated (P < 0.05) in reference to individual samples. The two methods consistently reveal an exceptionally high methylation of cg10690677 (E) and minimal methylation of cg25291941 (F) among individual subjects, while there is no correlation between the two sets of values for either site in a case-based manner (likely due to ceiling and floor effects, respectively).

