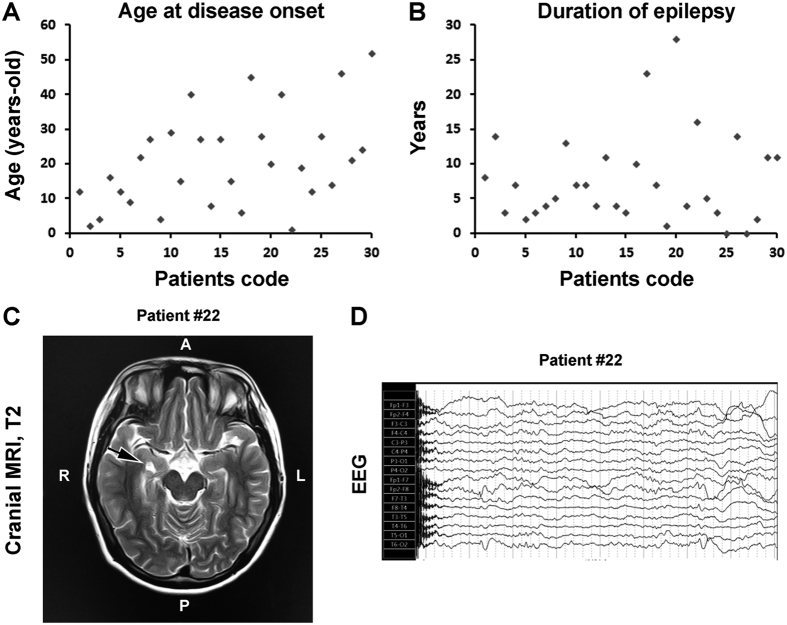
Figure 7. Case-sensitive presentation of age at onset and duration of epilepsy, and representative brain imaging and electroencephalograph (EEG) script from the patient group.
Dot graphs plot the age of onset (A) and duration (B) of epilepsy among the 30 patients listed from 1–30. Panel (C) shows a cranial T2 weighted Magnetic Resonance Imaging (MRI) film from patient #22, with the arrow pointing to enhanced T2 signal suggestive of sclerosis of the right-side hippocampus. Panel (D) shows slow and spike waves recorded on regions representing the right temporal lobe of this patient during awake and sleep, especially evident at anterior temporal area.

