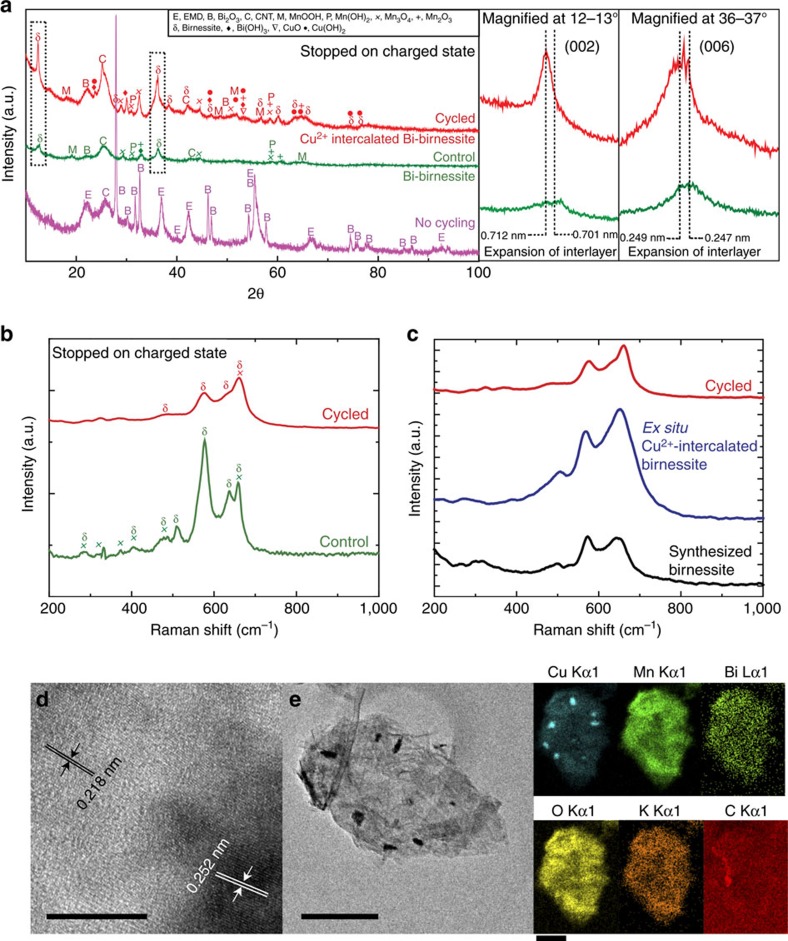
Figure 3. Characterization of cycled (with Cu) and control (no Cu) electrodes.
(a) XRD of cycled Cu Bi-birnessite, cycled Bi-birnessite without Cu and uncycled initial electrode mix. Magnified panels show interlayer expansion in the case with Cu. (b) Raman spectra of cycled and control electrodes. (c) Raman spectra of cycled electrode, Cu2+-intercalated birnessite produced ex situ and synthetic birnessite. (d) HRTEM image of the cycled electrode. The darker region and lighter region is indexed to δ-MnO2. (e) TEM EDX mapping of a region of the cycled electrode. Scale bars in d,e are 10 and 500 nm, respectively. Scale bar for maps in e is 250 nm.

