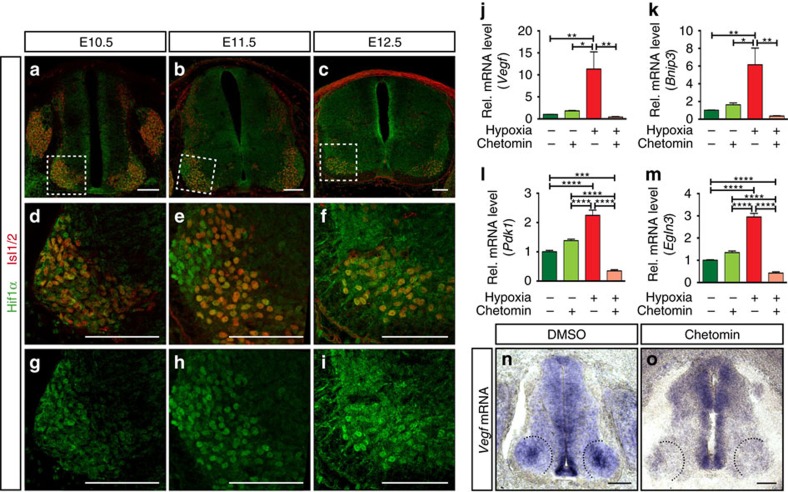
Figure 2. VEGF expression is regulated by HIF1α.
(a–c) Representative images of SCs at the developmental stages indicated, showing HIF1α staining in post-mitotic MNs (Isl1/2+). (d–i) Higher magnifications of insets in a–c showing co-localization of HIF1α and Isl1/2+ (d–f) or just HIF1α staining (g–i). Note the changes of HIF1α nuclear localization during development. (j–m) qRT-PCR analysis of changes in expression levels of Vegf (j) and other prototypical HIF target genes (Bnip3 (k), Pdk1 (l) and Egln3 (m)), when explants from mouse E11.5 MN columns are cultured under normoxia (20% O2) (green bars) or hypoxia conditions (1% O2) (red bars), with or without chetomin. Data are represented as mean±s.e.m. n=2 individual experiments done in triplicates. (j) *P=0.0161, **P=0.0086 (normoxia versus hypoxia), **P=0.0082 (hypoxia versus hypoxia+chetomin); (k) *P=0.0169, **P=0.0056 (normoxia versus hypoxia), **P=0.0018 (hypoxia versus hypoxia+chetomin); (l) ***P=0.0007, ****P<0.0001; (m) ****P<0.0001. One-way ANOVA using Tukey's multiple comparisons test was performed for (j–m) and P Values were adjusted to account for multiple comparisons. (n,o) Representative images of ISH for Vegf mRNA in chicken embryos (HH27) treated either with control (DMSO) (n) or with chetomin (o). Note the absence of Vegf expression in MN columns of the chetomin-treated embryo (black dotted lines: MN columns). Scale bars 100 μm. ANOVA, analysis of variance.

