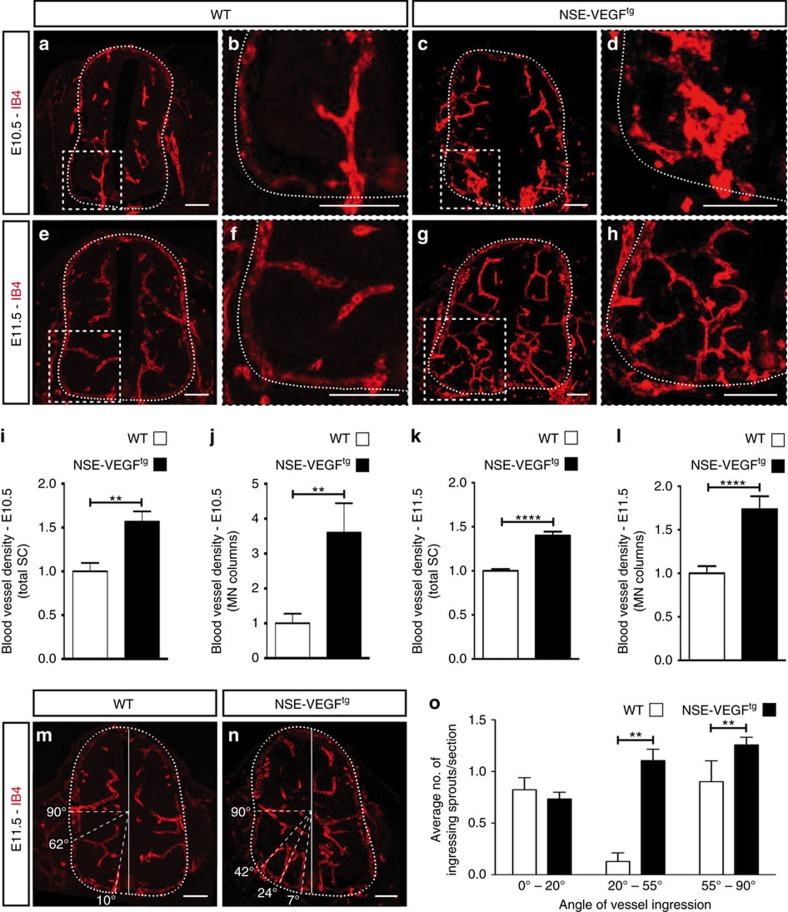
Figure 3. Overexpression of VEGF in the ventral spinal cord leads to premature blood vessel ingression into MN columns.
(a–h) Transverse SC sections stained for endothelial cells (IB4+) at E10.5 (a–d) and at E11.5 (e–h) reveal increased blood vessel density in the SC of NSE-VEGFtg (c,d,g,h) compared with WT (a,b,e,f) embryos, especially at the level of MN columns (insets). Higher magnifications of insets in (a,c,e,g) are shown in (b,d,f,h), respectively. (i–l) Quantification of blood vessel density in the entire SC (i,k) or within MN columns (j,l) for E10.5 (i,j) and E11.5 (k,l) WT and NSE-VEGFtg embryos. For E10.5: n=5 WT embryos and n=11 NSE-VEGFtg embryos from three different litters. **P=0.0023 (total SC), **P=0.0094 (MN columns). For E11.5: n=15 WT embryos and n=41 NSE-VEGFtg embryos from eight different litters. ****P<0.0001. (m,n) Representative images of blood vessel ingression analysis in the ventral half of the SC in a WT embryo (m) and its NSE-VEGFtg littermate (n). Dashed lines indicate the respective ingression angle for the different ingressing sprouts. (o) Quantitative analysis of blood vessel ingression angles into the ventral half (0°–90°) of E11.5 SCs. Note that in NSE-VEGFtg embryos blood vessels ingress significantly more often through the MN columns (20°–55°) compared with WT littermates. n=11 WT embryos and n=24 NSE-VEGFtg embryos from six different litters. **P=0.0038 (20°–55°), **P=0.0080 (55°–90°). Data are represented as mean±s.e.m. Scale bars 100 μm.

