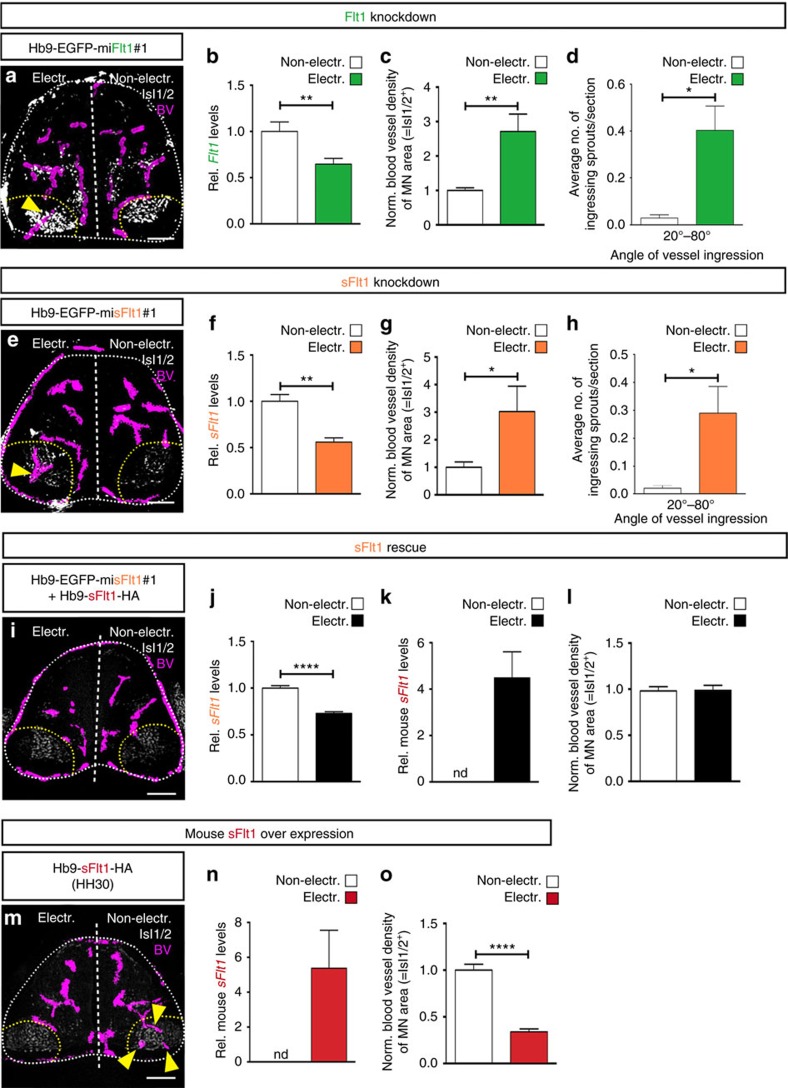
Figure 6. MN-specific deletion of sFlt1 leads to premature ingression of blood vessels into MN columns.
(a,e) Representative images of Hb9-EGFP-miFlt1#1 (a) or Hb9-EGFP-misFlt1#1 (e) electroporated chicken embryos showing blood vessel ingression (blood vessels (BV) labelled by ISH for Vegfr2 are traced in purple) into MN columns in the electroporated side of the SC (yellow arrowheads) but not in the non-electroporated one. (b,f) qRT-PCR analysis confirms downregulation of Flt1 (mFlt1+sFlt1) (b) or sFlt1 (f) levels. n=4, **P=0.0022 for (b) and n=4, **P=0.0042 for (f). (c,g) Quantification of blood vessel density in MN columns (Isl1/2+) shown as ratio between electroporated side and non-electroporated one. n=8, **P=0.0012 for (c) and n=8, *P=0.0366 for (g). (d,h) Quantification of the angle of ingression showing a significant increase in blood vessel sprouts ingressing into MN columns in the electroporated side but not in the non-electroporated one. n=11, *P=0.0147 for (d) and n=12, *P=0.0408 for (h). (i) Representative image of sFlt1 rescue experiment showing no blood vessel ingression into MN columns in the electroporated side of the SC as well as in the non-electroporated one. (j) qRT-PCR analysis confirms downregulation of chicken sFlt1 levels in MN columns in the electroporated side. n=6, ****P<0.0001. (k) qRT-PCR analysis confirms expression of mouse sFlt1 in MN columns in the electroporated side. nd=not detectable. n=6. (l) Quantification of blood vessel density in MN columns (Isl1/2+) shown as ratio between electroporated and non-electroporated side. n=4, P=ns. (m) Representative image of chicken SC at HH30, in which a mouse sFlt1-HA plasmid was unilaterally electroporated at HH17. (n) qRT-PCR analysis confirms expression of mouse sFlt1 in MN columns of the electroporated side but it is not detectable (nd) in the non-electroporated side. n=7. (o) Quantification of blood vessel density in MN columns (Isl1/2+) shown as ratio between electroporated and non-electroporated side. n=9, ****P<0.0001. Scale bars 100 μm.

