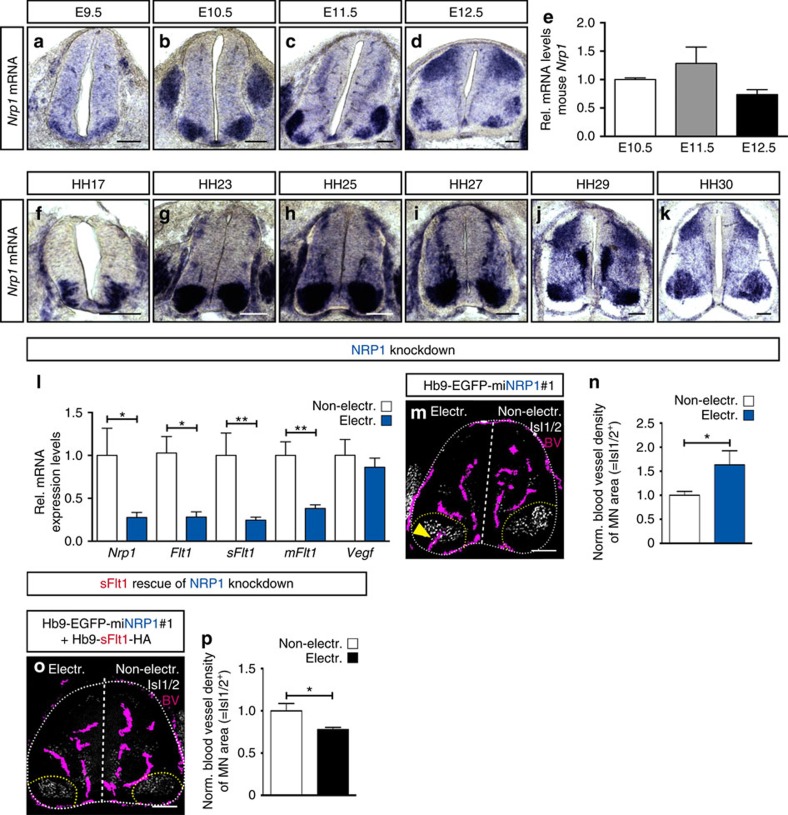
Figure 7. NRP1 regulates sFlt1 expression and as a consequence blood vessel guidance.
(a–d) Representative images of ISH for Nrp1 in mouse SC sections at the developmental stages indicated. Note the changes in Nrp1 expression levels and in its expression pattern during development. (e) qRT-PCR analysis of Nrp1 in microdissected MN columns at E10.5, E11.5 and E12.5. Data are represented as mean±s.e.m. n=4 individual experiments done in triplicates. (f–k) Representative images of ISH for Nrp1 in chicken SC sections at the developmental stages indicated. (l) qRT-PCR analysis showing downregulation of Nrp1, Flt1 (mFlt1+sFlt1), sFlt1 and mFlt1 levels in MN columns of chicken embryos electroporated with Hb9-EGFP-miNRP1#1. Vegf mRNA levels are unaffected. n=7, *P=0.0437 (Nrp1), *P=0.0306 (Flt1), **P=0.0081 (sFlt1), **P=0.0055 (mFlt1) and P=ns (Vegf). (m) Representative image of Hb9-EGFP-miNRP1#1 electroporated chicken embryos showing blood vessel ingression into MN columns in the electroporated side of the SC (yellow arrowhead) but not in the non-electroporated one. (n) Quantification of blood vessel density in MN columns (Isl1/2+) shown as ratio between electroporated and non-electroporated side in Hb9-EGFP-miNRP1#1 embryos. n=8, *P=0.0274. (o) Representative image of rescue experiment, in which Hb9-EGFP-miNRP1#1 is co-electroporated with a mouse sFlt1-HA plasmid. (p) Quantification of blood vessel density in MN columns (Isl1/2+) shown as ratio between electroporated and non-electroporated side. n=6, *P=0.0349. Scale bars 100 μm.

