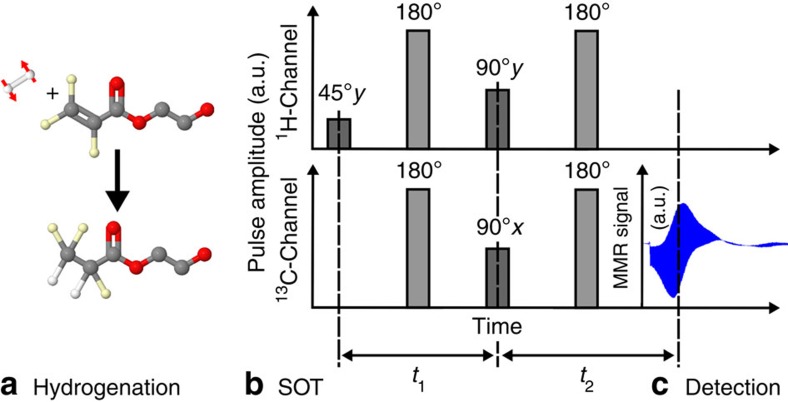
Figure 8. Schematic view of the HP method:
The tracer to-be-hyperpolarized is formed by catalytic addition of pH2 to an unsaturated precursor molecule (a, here: hydroxyethyl-acrylate forms the angiography-tracer27,30 HEP). Next, a pulse sequence is applied subsequently to transfer the spin order (grey bars, here: PH-INEPT+ (ref. 45)), and the enhanced 13C signal is recorded (c). In b, refocusing pulses are shown in light grey. (c) Real 13C-data in the time domain acquired after one HP experiment.

