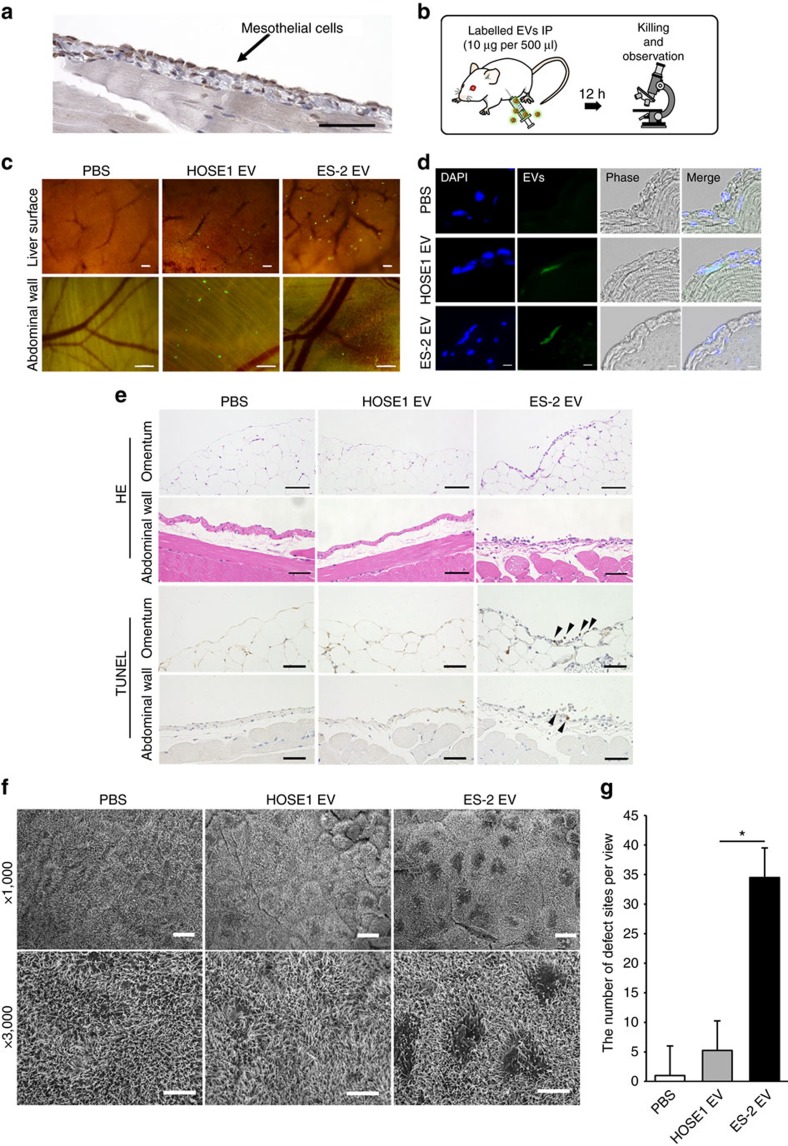
Figure 3. The EVs from highly metastatic cell lines damage the peritoneum and induce apoptosis in vivo.
(a) Representative slide of a mouse peritoneal membrane (single-layered mesothelial cells) that was immunostained with mesothelin. The abdominal wall was dissected from the mouse. Scale bar, 100 μm. (b) Schematic protocol for the uptake of EVs into the peritoneal membrane. The EVs from ES-2 cells were labelled with PKH67 and 20 μg was injected i.p. (c) Stereomicroscopic images showing labelled EVs that were incorporated into the peritoneum. Mice were killed after i.p. injection of PKH67-labelled EVs (20 μg). Green dots indicate EVs and the peritoneum on the liver surface and abdominal wall was observed. For the control, the same amount of PBS labelled by PKH67 green was used. Scale bars, 500 μm. (d) Representative microscopic section images of the abdominal wall treated with labelled EVs (DAPI: nuclei, green: EVs). The sections were cut to a thickness of 10 μm. Scale bars, 10 μm. (e) Representative microscopic images of HE-stained and TUNEL-stained slides from the abdominal wall and omentum. EVs were injected i.p. into mice (30 μg of EVs with 500 μl of PBS/12 h, 5 times). Black arrowheads indicate positive cells. Scale bars, 100 μm. (f) Representative SEM images of the abdominal wall treated with EVs. The EVs were injected i.p. into mice (30 μg of EVs with 500 μl of PBS/12 h, 5 times). The surface of the peritoneum is covered with numerous microvilli. Scale bars, 10 μm (upper 3 images) and 5 μm (lower three images). (g) Quantitative analysis of the damaged sites from SEM images. The defective sites were counted from 1,000 images that were randomly selected. Error bars represent s.d. Student's t-test (*P<0.01). The data are representative of at least three independent experiments. c,d,f,g).

