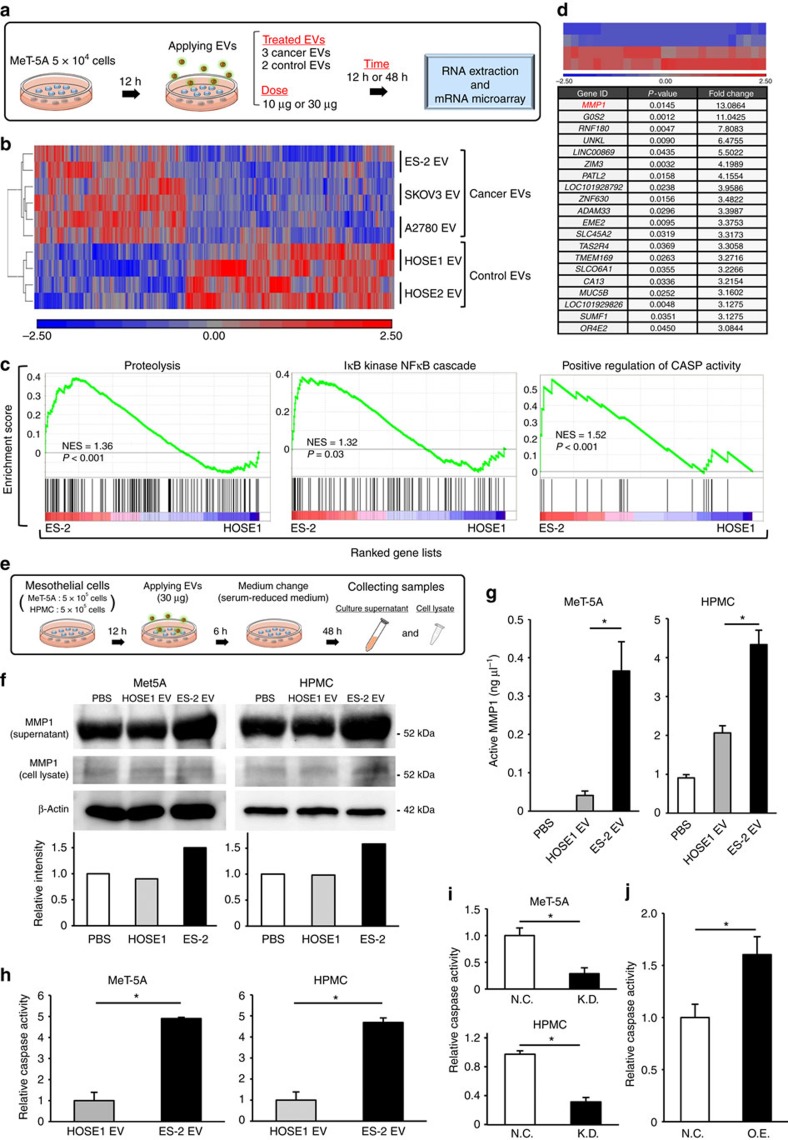
Figure 5. MMP1 mRNA in EVs is a key molecule for the destructive phenotypes in mesothelial cells.
(a) Schematic protocol for the gene expression analysis in mesothelial cells that were treated with EVs. (b) A heat map showing 482 differentially expressed genes (time point: 48 h, cancer EVs vs control EVs, change >1.5-fold and P<0.05) in MeT-5A cells treated with EVs. (c) GSEA of the mesothelial cells treated with ES-2 EVs versus those with HOSE1 EVs, highlighting the destructive phenotypes. NES: a normalized enrichment score. The P-values in the graphs were calculated by GSEA analysis. (d) A heat map showing the expression levels of 27 genes (time point: 48 h, change >3-fold and P<0.05) comparing mesothelial cells treated with ES-2 EVs with those treated with HOSE1 EVs. The lower panel shows the gene lists (top 20) of the above heat maps. (e) Schematic protocol for investigating the function of MMP1 mRNA in EVs. This protocol was applied in f,g. (f) Immunoblot analysis of MMP1 and β-actin. The intensity of the bands (supernatant) was measured by LAS-4000. The intensity of backgrounds was subtracted in all samples. (g) MMP1 activity assay in the cell culture supernatant. The activity was measured using an enzyme-linked immunosorbent assay (ELISA) for MMP1. The concentration of active MMP1 protein is shown. Error bars represent s.d., Student's t-test (*P<0.01). (h) Caspase activity in Met-5A cells and HPMCs treated with EVs by using a Caspase-Glo 3/7 assay. The activity of both mesothelial cells treated with PBS was subtracted from those of ES-2 EV and HOSE1 EV. Error bars represent s.d. Student's t-test (*P<0.01). (i) Caspase activity in Met-5A cells and HPMCs treated with EVs derived from the MMP1 shRNA-expressing ES-2 cells (KD) or control (NC, negative control). Error bars represent s.d. Student's t-test (*P<0.01). (j) Caspase activity in MeT-5A cells transfected with a MMP1-overexpressing vector (O.E.) or control (N.C.). Error bars represent s.d. Student's t-test (*P<0.01). The data are representative of at least three independent experiments each (f–j).

