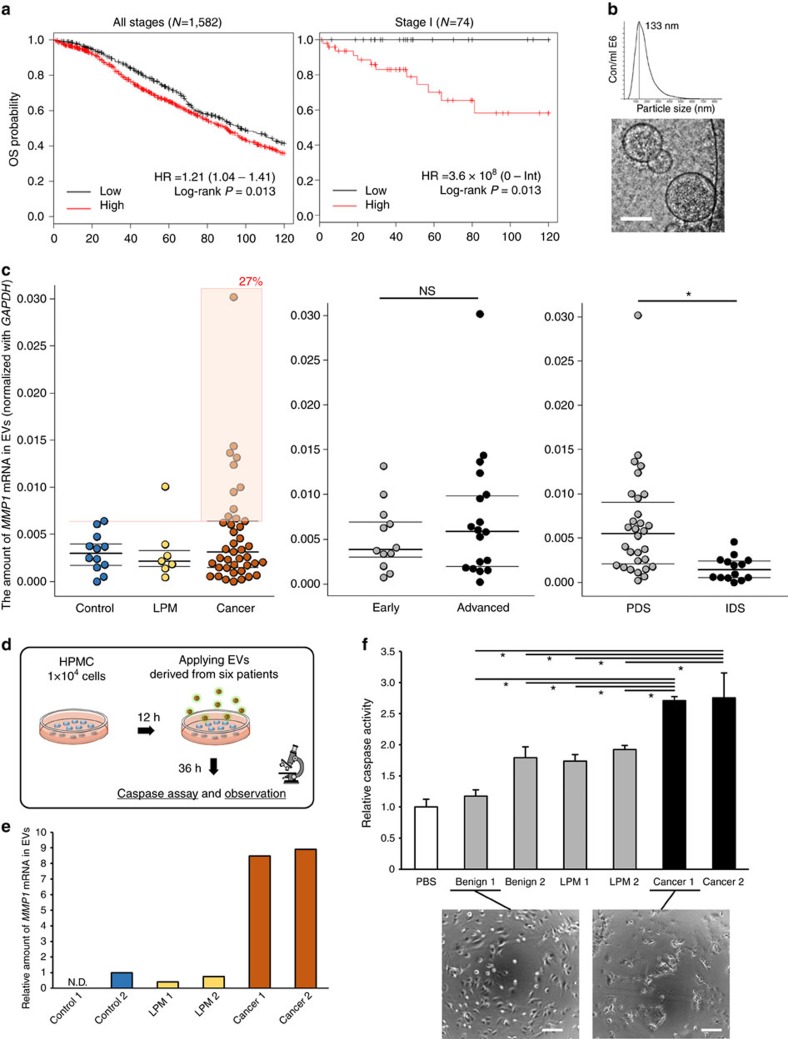
Figure 6. EVs carrying MMP1 mRNA are present in patient-derived ascites and the EVs also induce apoptosis in mesothelial cells in vitro.
(a) Kaplan–Meier analysis for the probability of overall survival in ovarian cancer patients according to the expression of MMP1. HRs and P-values (log rank P) are shown for each survival analysis. The left curve indicates the outcome of the patients in all stages, and the right one is from stage l patients. Kaplan–Meier curves were generated using the KMplot software from a database of public microarray data sets (http://kmplot.com/analysis). (b) Characterization of the EVs from patients' ascites. Nanoparticle tracking analyses showing the particle size of the EVs. Phase-contrast electron microscopy was used to visualize the EVs. Scale bar, 100 nm. (c) Distribution of MMP1 mRNA in patient ascites-derived EVs. The left plot shows the amount of MMP1 mRNA among control (benign diseases), LPM (low potential malignancy) and cancer patients. The orange box indicates high-expressing cancer patients compared with the controls. n=12 control, 7 LPMs and 41 cancer. The middle plot shows the comparison between early-stage and advanced-stage patients. n=12 early and 18 advanced. The right plot shows the comparison between patients who underwent PDS (primary debulking surgery) and IDS (intermediate debulking surgery). All patients who underwent IDS were treated with neoadjuvant chemotherapy. n=30 PDS and 14 IDS. The amount of MMP1 mRNA in EVs was normalized to GAPDH. Student's t-test (*P<0.05 and NS, no significance). (d) Schematic protocol to investigate the effect of patient-derived EVs on mesothelial cells. The same number of EV particles was added to the HPMCs. (e) The amount of MMP1 mRNA in EVs among six selected patients. Two patients were selected whose ascites-derived EVs were enriched in MMP1 mRNA. The amount of MMP1 mRNA in EVs was normalized to GAPDH. (f) Caspase activity in mesothelial cells treated with EVs from patients' ascites measured by the Caspase-Glo 3/7 assay. Error bars represent s.d., Dunnett's t-test (*P<0.01). Representative microscopic images of mesothelial cells treated with two types of EVs. Scale bars, 100 μm.

