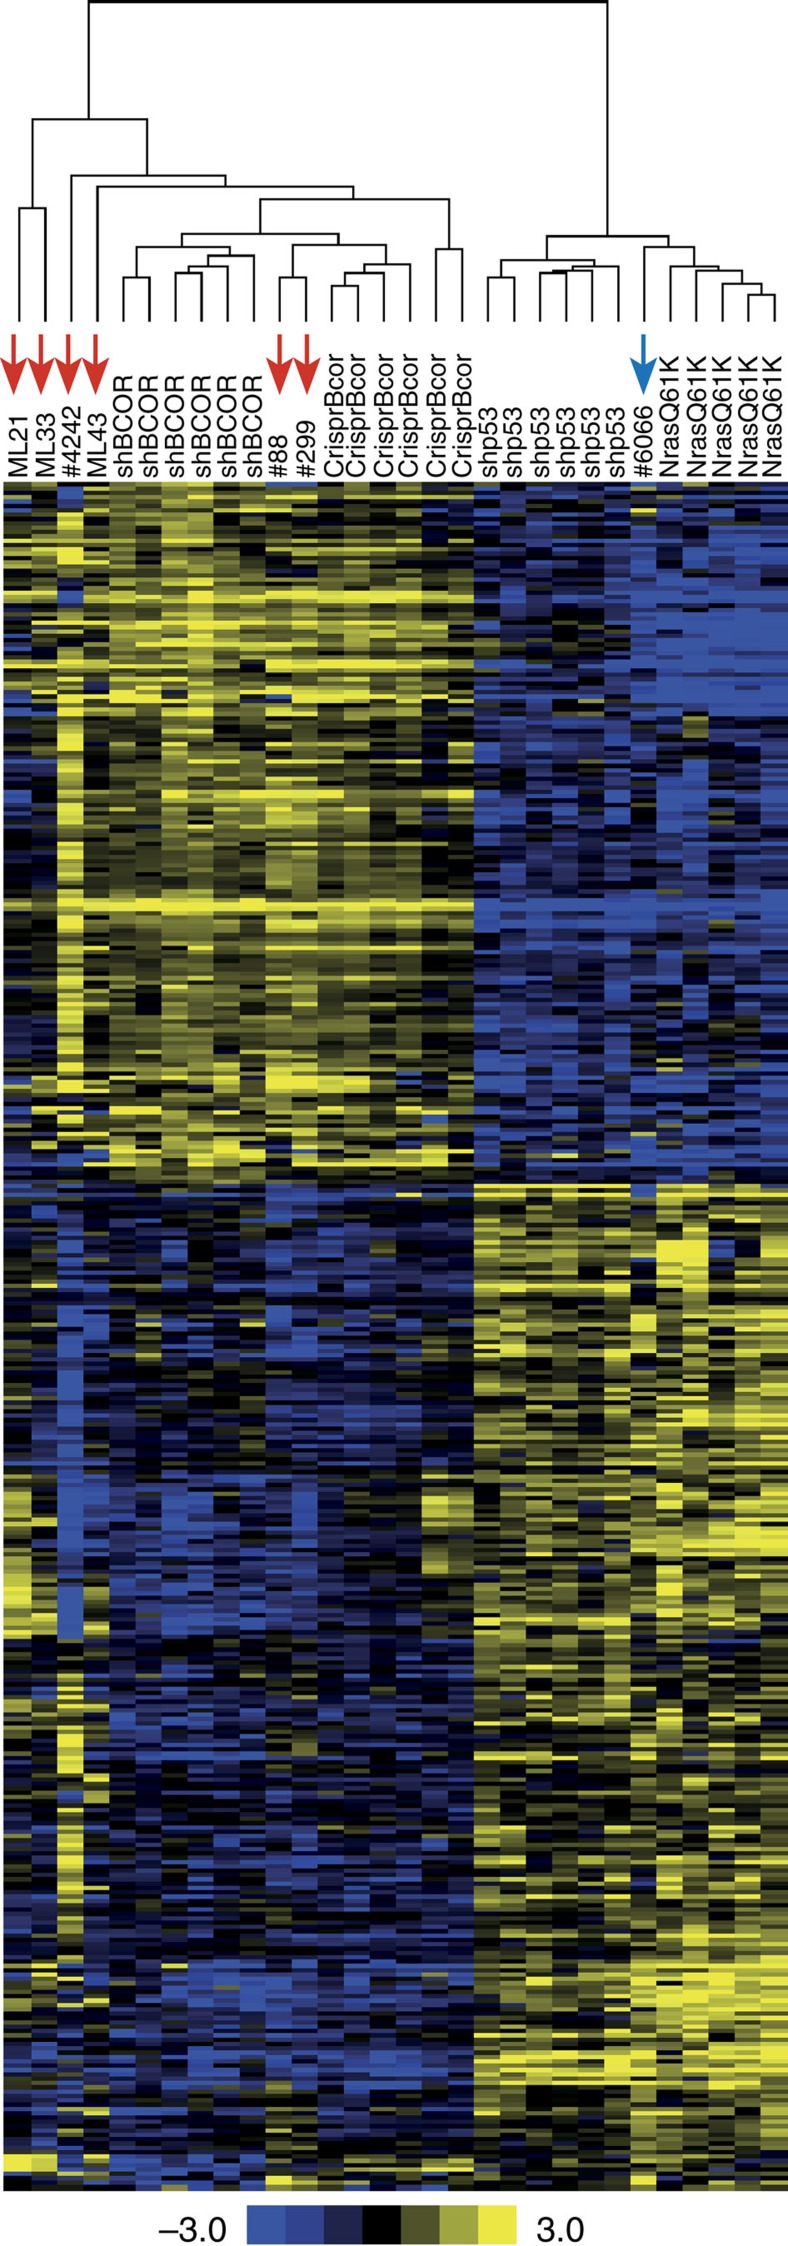
Figure 6. Gene-expression profiling of Eμ-Myc lymphomas identified a reproducible signature of Bcor mutation or knockdown.
RNA-seq analysis was first used to identify 393 significantly differentially expressed genes (FDR-corrected<0.05 and log2 fold-change≥2) between pLMS.sh.Bcorsh9 and combined pLMS.sh.Bcorsh9 and overexpressing NrasQ61K fetal liver-derived Eμ-Myc lymphomas. RNA-seq data for shRNA fetal liver-derived lymphomas plus CRISPR-Cas9 (CrispR.BcorT2) and sporadic Eμ-Myc lymphomas was then clustered using the 393 gene set. All CrispR.BcorT2 and sporadic Bcor mutant lymphomas (red arrows) cluster with the pLMS.sh.Bcorsh9 fetal liver-derived lymphomas. The sporadic NrasQ61K mutant cell line #6066 (blue arrow) also clustered correctly with NrasQ61K overexpressing fetal liver-derived lymphomas. Heatmap and scale bar represents median normalized log2-fold gene-expression.

