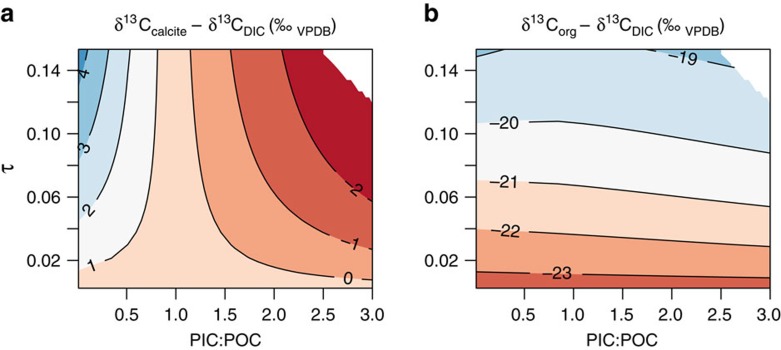
Figure 3. Effect of cellular utilization and PIC:POC on isotopes.
Summary of model output—isotopic compositions as a function of PIC:POC and of the utilization parameter, τ. τ approximates utilization, and is a dimensionless linear function of growth rate, cell size [DIC], as defined in equation (1). (a) Calcite carbon isotopic compositions depend strongly on PIC:POC—if PIC:POC is high, calcite becomes isotopically light as utilization increases, if PIC:POC is low, calcite becomes isotopically heavy as utilization increases. (b) The carbon isotopic composition of organic matter is largely independent of PIC:POC, and is a strong function of the utilization parameter.

