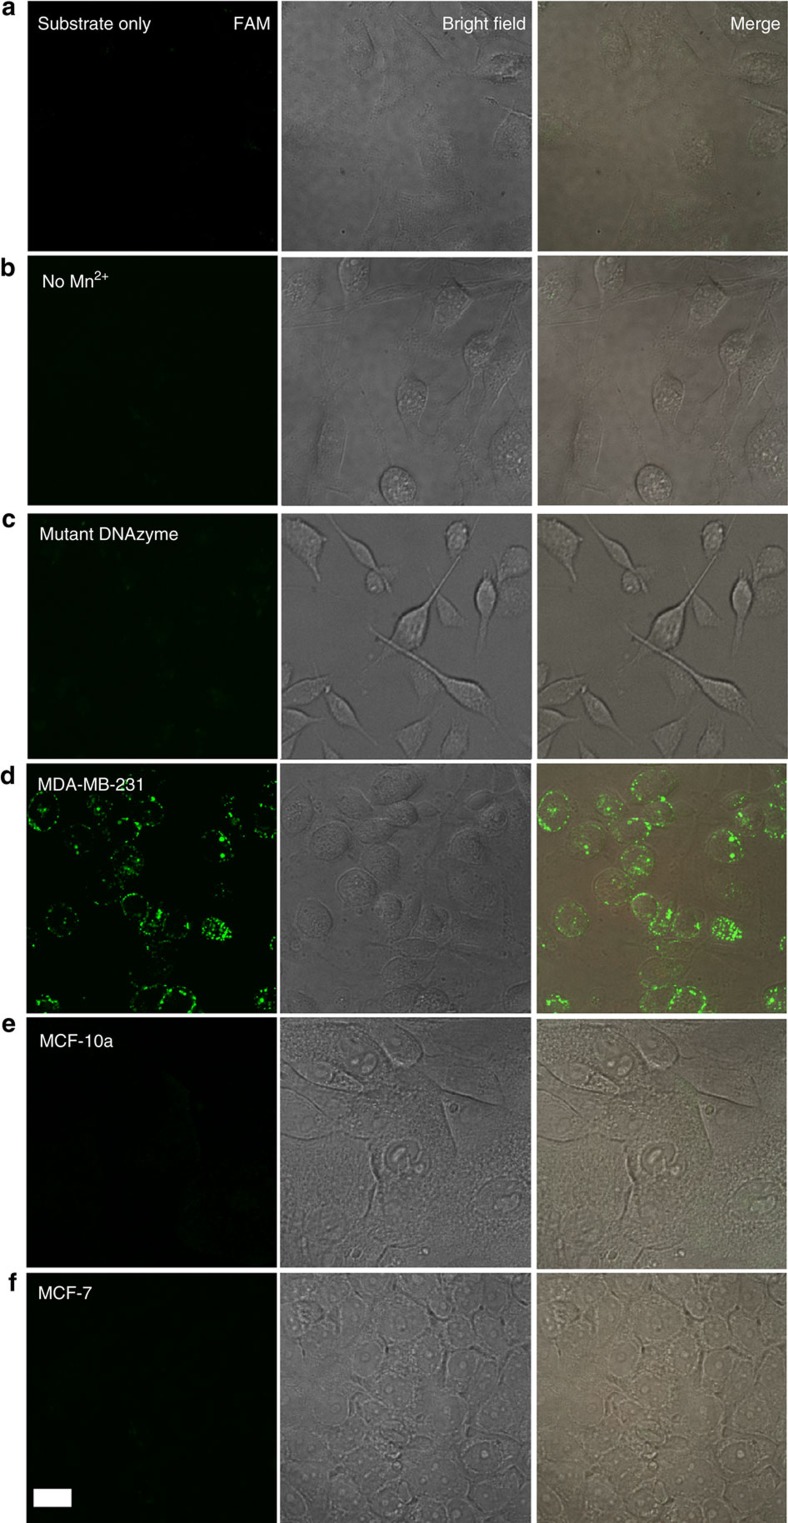
Figure 5. Imaging of live cells after uptake of the DNAzyme motor system.
(a) Images showing MDA-MB-231 cells after incubation with AuNPs functionalized with the substrate strand but not the DNAzyme strand (negative control). (b) Images showing MDA-MB-231 cells after incubation with the DNAzyme motor system but not subsequently treated with the cofactor Mn2+ (negative control). (c) Images showing the target MDA-MB-231 cancer cells after incubation with a mutant DNAzyme motor system and the subsequent treatment with the cofactor Mn2+ (negative control). (d) Images showing the target MDA-MB-231 cancer cells after incubation with the DNAzyme motor system and the subsequent treatment with the cofactor Mn2+. Fluorescence images of the target cells are the result of intracellular operation of the DNAzyme motor. (e) Images showing the negative control MCF-10a cells after the same treatment as for the MDA-MB-231 cells in d. (f) Images showing the negative control MCF-7 cells after the same treatment as for the MDA-MB-231 cells in d. All images were collected at the end of 60 min operation time (i.e., 60 min after the addition of the cofactor Mn2+). Fluorescence imaging of living cells was performed using an Olympus IX-81 microscope equipped with a Yokagawa CSU × 1 spinning disk confocal scan-head and a Hamamatsu EMCCD camera with × 40/1.3 Oil and × 20/0.85 Oil objective lenses. A pumped diode laser at 491 nm was used for the excitation of FAM. Magnification was chosen to allow a final pixel size of 447 nm with × 20 lens and 223 nm with × 40 lens. The length of the scale bar is 17 μm.

