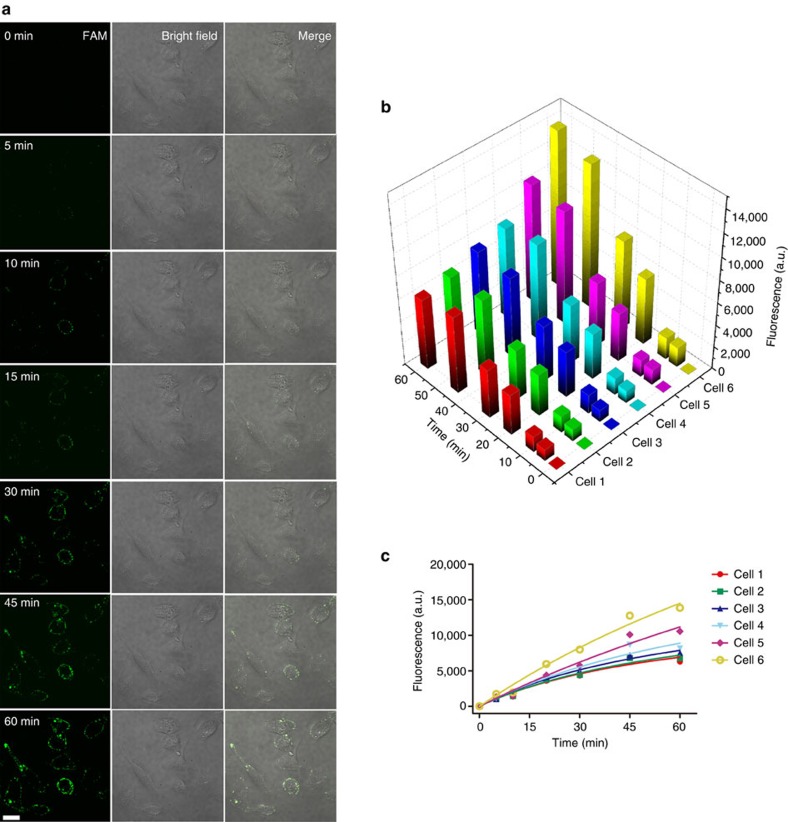
Figure 6. Images and fluorescence intensity of target cells upon operation of the DNAzyme motor.
The DNAzyme motor was designed to respond to the intracellular miRNA miR-10b. (a) Images of MDA-MB-231 cancer cells after intracellular operation of the DNAzyme motor for 0, 5, 10, 15, 30, 45 and 60 min. 0 min refers to the time point when Mn2+ is added into the operating buffer. The LMM5 laser transmission setting was 85 and the laser excitation time was 185 ms for each image. (b,c) Fluorescence intensity of six cells over the 60 min operation time of the DNAzyme motor. The fluorescence intensity was measured using ImageJ 1.47. The length of the scale bar is 17 μm.

