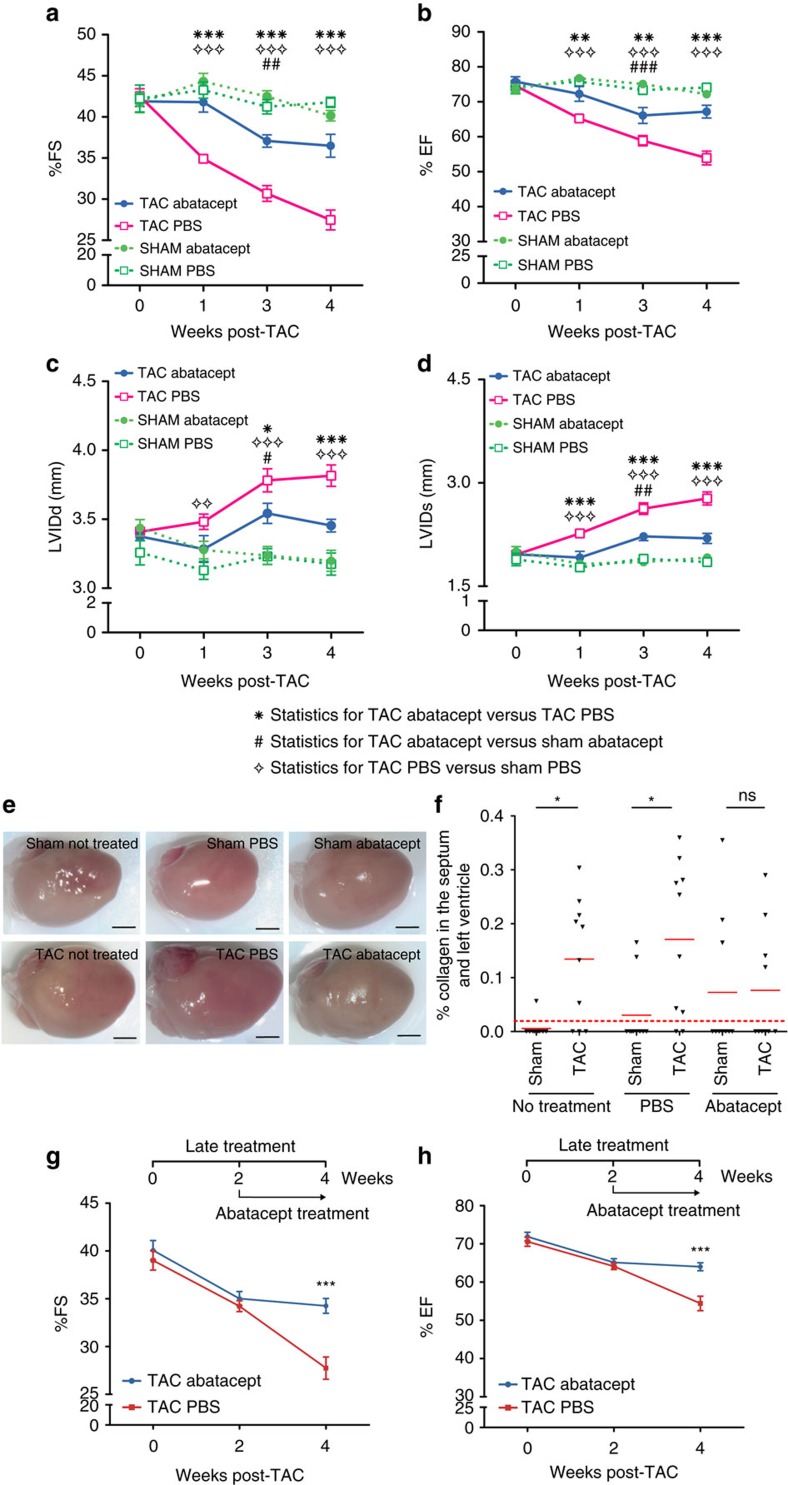
Figure 3. Abatacept blunts progression of cardiac dysfunction in pressure-overloaded mice.
Mice underwent TAC or sham operation; 2 days post-operation, the mice were treated with three intraperitoneal injections per week of 200 μg of abatacept or PBS, for 4 weeks. (a) Fractional shortening (%FS), (b) ejection fraction (%EF), (c) left ventricle internal dimension in diastole (LVIDd) and (d) left ventricle internal dimension in systole (LVIDs) in TAC- and sham-operated mice at baseline and at time points 1, 3 and 4 weeks after operation, with and without abatacept administration. Data show the mean %FS, %EF, LVIDd and LVIDs for each experimental group at all time-points±s.e.m. (n=7–9). Two-way analysis of variance (ANOVA) with Bonferroni post-test: P values shown in the panel. Abatacept ameliorates pressure overload-induced cardiac fibrosis in mice. (e) Representative macroscopic images of the heart of untreated, PBS-treated and abatacept-injected mice 4 weeks post-sham- or TAC (scale bar=2mm). (f) Cardiac sections of untreated, PBS-treated or abatacept-treated, TAC- or sham-operated mice, at 4 weeks post-operation were stained with Azan's trichrome (n=2). Five identical regions of interest (ROIs) were applied to all samples. The collagen staining intensity was quantified by image acquisition software; plot points indicate the % of collagen pixels in each ROI. Red bars indicate the mean % collagen in each experimental group. ROIs with a collagen signal higher than zero were considered fibrotic. Fisher's exact tests for the presence or absence of fibrosis were applied to sham versus TAC-operated groups for each treatment category. The dotted red line separates fibrotic from non-fibrotic ROIs. *P value<0.05. (g,h) Mice underwent TAC, 2 weeks post-operation, the mice were treated with three intraperitoneal injections per week of 200 μg of abatacept or PBS, for 2 weeks. (g) Fractional shortening (%FS) and (h) ejection fraction (%EF) were measured at baseline and at 2 and 4 weeks after operation. Data show mean of %FS and %EF for each experimental group at all time-points±s.e.m. (n=7). Two-way ANOVA with Bonferroni post-test: ***P value<0.001.

