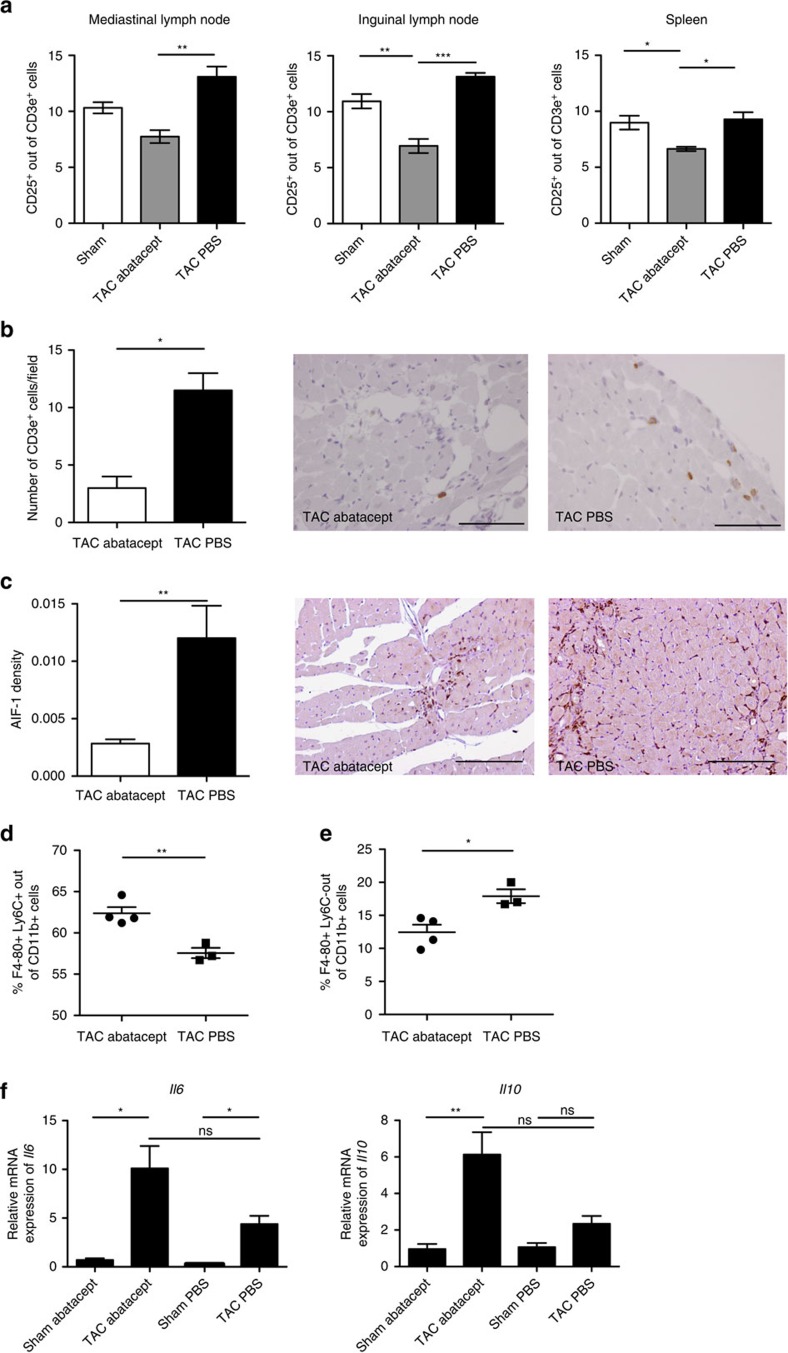
Figure 4. Abatacept administration suppresses the immune response in TAC-operated mice.
(a) Mediastinal (heart-draining), inguinal lymph nodes and spleens were collected 1 week after TAC or sham-operation, stained and analysed by flow cytometry. Percentage of CD25+ out of CD3e+ cells are plotted as mean±s.e.m.; sham (white bars), TAC abatacept (grey bars) and TAC PBS (black bars) (n=3). One-way analysis of variance (ANOVA) with Tukey's post-test: *P value<0.05; **P value<0.01, ***P value<0.001. (b) Statistical analysis of immunohistochemical staining of left ventricles for the T cell marker CD3e in TAC mice at 4 weeks post-operation, treated with abatacept or PBS, and representative images of the staining (brown colouration; original magnification 40 × ; scale bar=50 μm). Number of CD3e+ cells is plotted as mean±s.e.m.; TAC abatacept (white bars); TAC PBS (black bars). Unpaired t-test; *P value<0.05 (n=2). (c) Statistical analysis of immunohistochemical staining of left ventricles for the macrophage marker AIF-1 in TAC mice at 1 week post-operation, treated with abatacept or PBS, and representative images of the staining (brown colouration; original magnification 20 × ; scale bar=100 μm). AIF-1 density plotted as mean±s.e.m.; TAC abatacept (white bars); TAC PBS (black bars). Unpaired t-test; **P value<0.01 (n=2). (d,e) Cardiac single cell suspensions of TAC operated mice, 1 week after the operation, were stained and analysed by flow cytometry. Percentage of F4-80+ Ly6C+ out of CD11b+ CD45+ live cells (d) and F4-80+ Ly6C- out of CD11b+ CD45+ live cells (e) are plotted as mean±s.e.m.; TAC abatacept (black circles); TAC PBS (black squares). Unpaired t-test; *P value<0.05; **P value<0.01 (n=4, 3). (f) Gene expression analysis (TaqMan real-time qPCR) of the left ventricle of C57BL6/J mice, 1 week after TAC or sham operation, with abatacept or PBS treatment. Bars show relative mean Il6 and Il10 expression, internally normalized to 18 s ribosomal RNA expression. Values are mean±s.e.m. (n=5, 8). One-way ANOVA, Dunn's post-test: *P value <0.05; n.s., not significant.

