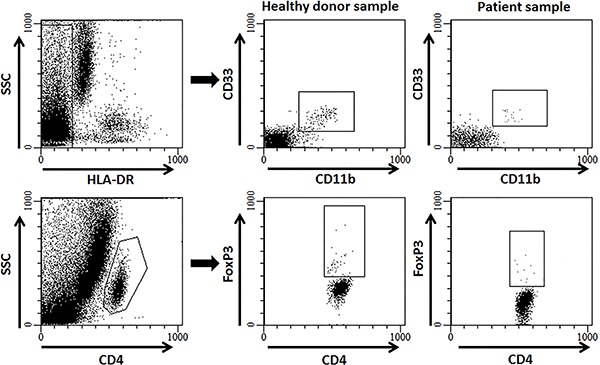
Figure 1. Representative flow cytometry showing labelling and gating strategies for myeloid-derived suppressor cells (MDSC) (top) and regulatory T (Treg) cells (bottom). MDSCs were defined as CD33+/CD11b+/HLA-DR- cells. Treg cells were defined as CD4+/FoxP3+ cells.