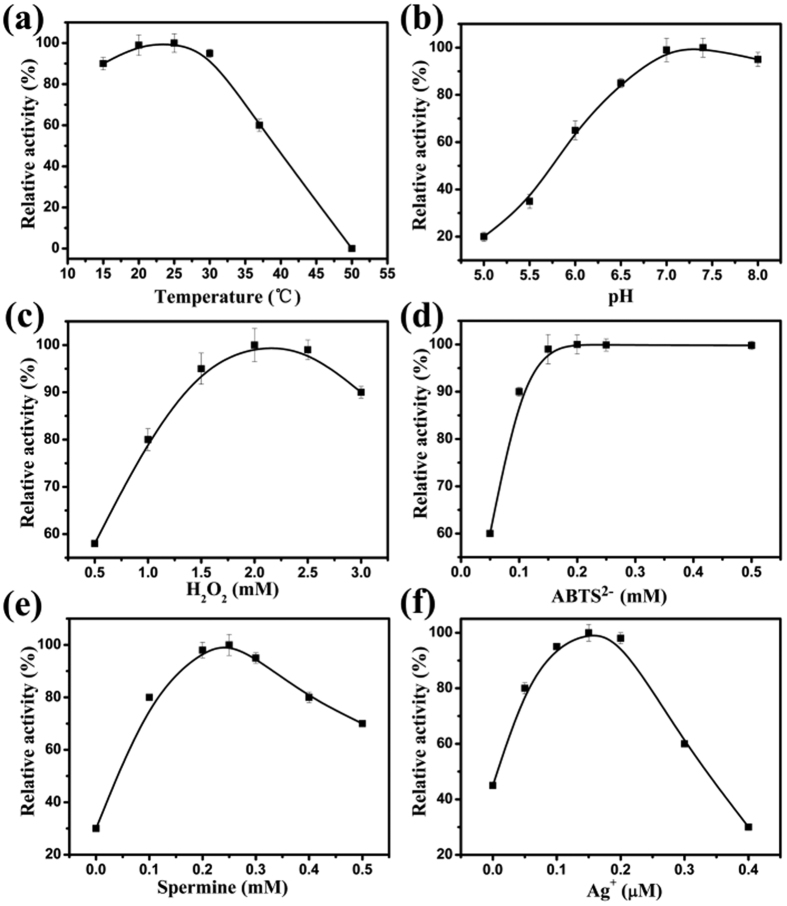
Figure 4.
Effect of different conditions on the time-dependent absorbance changes of the H2O2-ABTS2− reactions, involving the temperature of the reaction solution (a), pH value of Tris-Ac buffer (b), concentrations of H2 O2 (c), ABTS2− (d), spermine (e) and Ag+ (f). The error bars represent the standard deviation of the three measurements. The optimal point in each curve was set as 100%.

