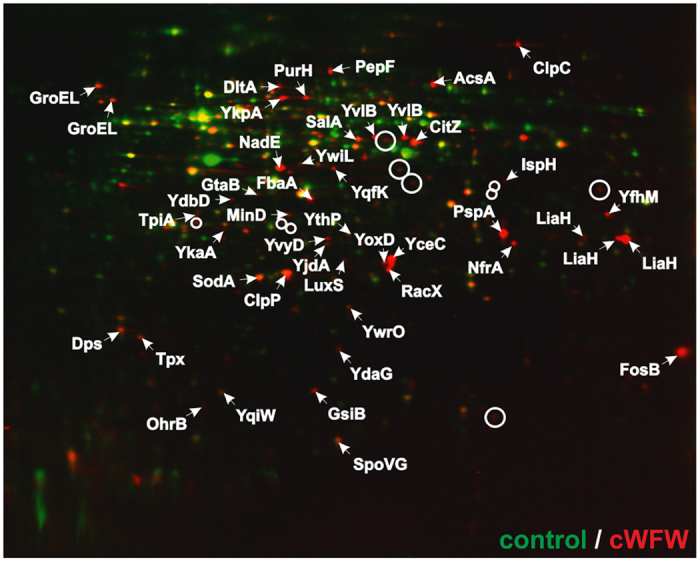
Figure 1. Cytosolic proteome response profile of B. subtilis to cWFW.

Autoradiographs of antibiotic-treated cells (red) were overlaid with those of untreated controls (green). Upregulated proteins in response to cWFW treatment (8 μM) appear red, down-regulated proteins green. Proteins synthesised at equal rates appear yellow. Proteins upregulated more than 2-fold in three biological replicates were defined as marker proteins and identified by mass spectrometry. Unidentified marker proteins are indicated by circles. See supplementary Figure 1a for the growth inhibition of B. subtilis observed in BMM with different cWFW concentrations. Strain used: B. subtilis 168/DSM 402.
