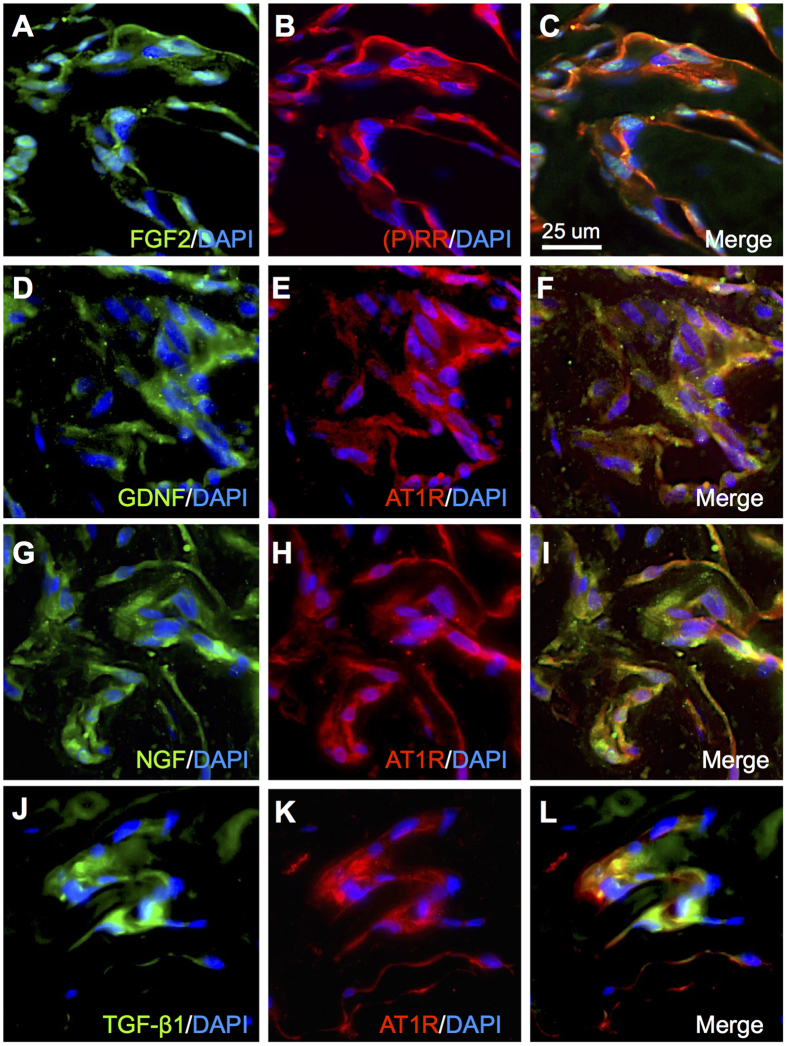
Figure 6. Co-localization of prorenin- and Ang II-induced cytokines with (P)RR and AT1R in iERM tissues.
(A–C) Double labeling of FGF2 (green), (P)RR (red) and DAPI (blue). (D–F) Double labeling of GDNF (green), AT1R (red) and DAPI (blue). (G–I) Double-labeling of NGF (green), AT1R (red) and DAPI (blue). (J–L) Double labeling of TGF-β1 (green), AT1R (red) and DAPI (blue). Scale bar: 25 μm.

