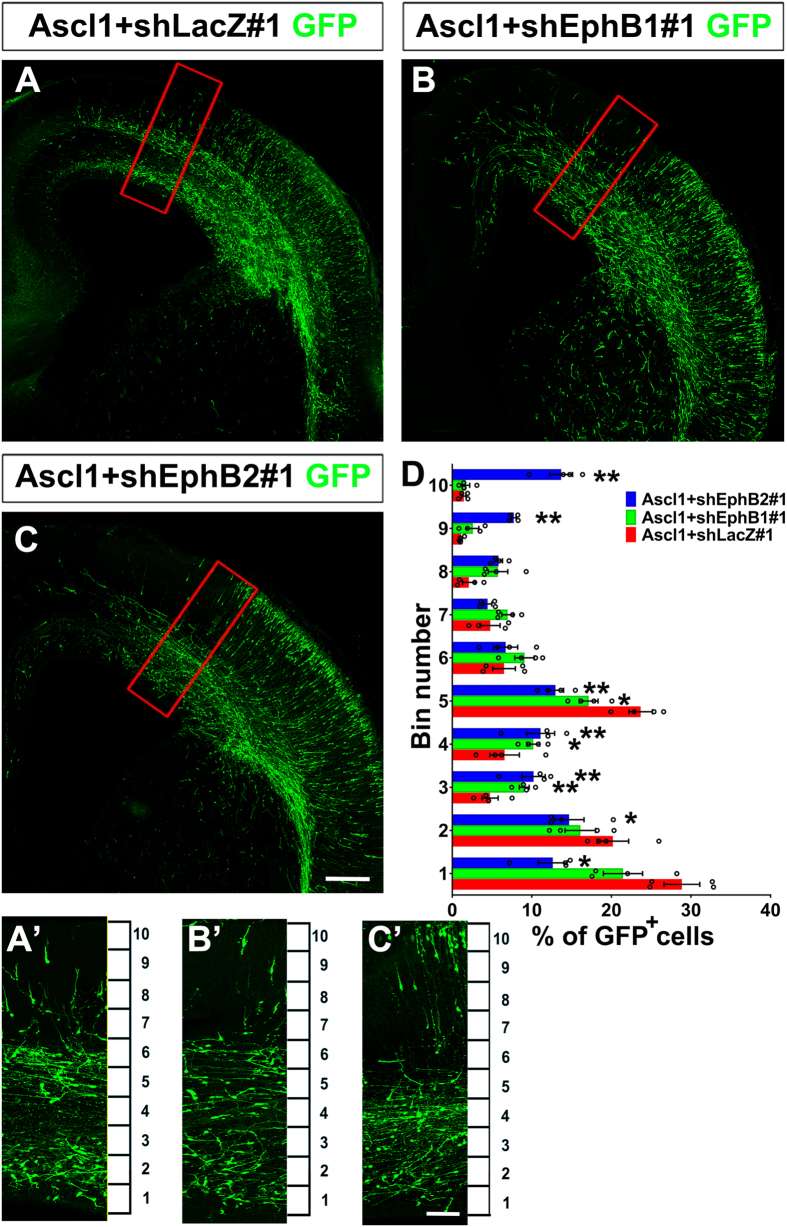
Figure 5. Knockdown of Ephb1 or Ephb2 disrupted tangential migration promoted by Ascl1.
Four days after electroporation to the dorsal telencephalon, brains of E19.5 rats were dissected and sectioned in the coronal plane. Electroporated cells were labeled with anti-GFP in green. (A’–C’) are zoomed regions of (A–C) indicated by red squares, which were dorsomedial to the electroporated site. The cortex was divided equally into 10 bins. (A) In Ascl1 + shLacZ#1 group, many GFP positive cells were distributed in the VZ/SVZ (bins 1 and 2) and IZ (bin 5). (B,C) In Ascl1 + shEphB1#1 and Ascl1 + shEphB2#1 groups, GFP-positive cells were distributed in the VZ/SVZ (bins 1 and 2) and IZ (bin 5) were reduced. Length of the scale bar is 120 μm in (A–C), and 40 μm in (A’–C’). (D) Distribution of GFP-positive in the cortex. Only GFP-positive cells dorsomedial to the electroporated site were counted. Data were presented as mean ± SEM with all data points and analyzed by one-way ANOVA with Tukey’s-HSD post hoc test, n = 4. *p < 0.05; **p < 0.01 compared to Ascl1 + shLacZ#1 group.

