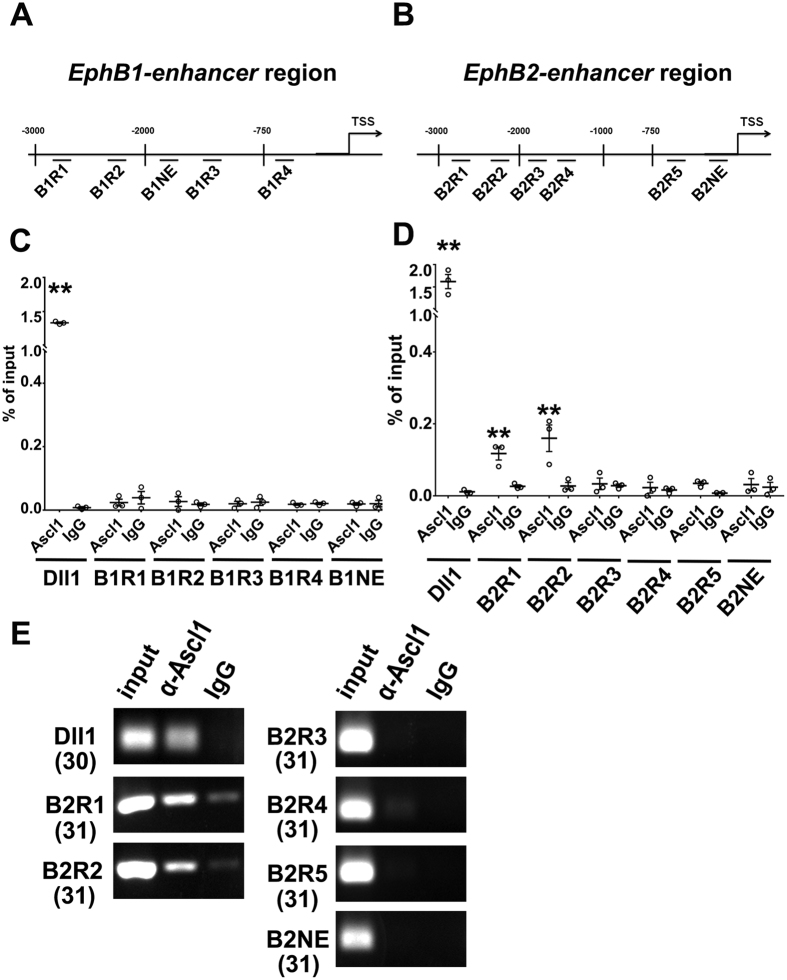
Figure 6. Ephb2 is a direct target of Ascl1.
(A,B) Putative E-box sequences were identified in the 3 Kb upstream of the transcription starting site (TSS) for Ephb1 and Ephb2. Four fragments (B1R1 to B1R4) of Ephb1 and five fragments (B2R1 to B2R5) of Ephb2 containing E-box sequences were designed for ChIP. Two fragments (B1NE and B2NE) without E-box sequences were selected as negative controls. (C,D) DNA from P19 cells transfected with Ascl1 expression vectors was extracted for ChIP. A fragment in the promoter region of Dll1 that has been demonstrated to interact with Ascl1 was used as a positive control. After ChIP, enrichment of the DNA fragments was quantified by qPCR (C,D) and regular PCR (E). (C) The promoter region of Dll1 was enriched by ChIP with anti-Ascl1. No fragment in Ephb1 was enriched. (D) The promoter region of Dll1, as well as B2R1 and B2R2 sites of Ephb2 were enriched by ChIP with anti-Ascl1. (E) Regular PCR result. The number in the parentheses indicated PCR cycle. Data were presented as mean ± SEM with all data points and analyzed by Student’s t-test, n = 3; *p < 0.05 compared to the IgG control.

