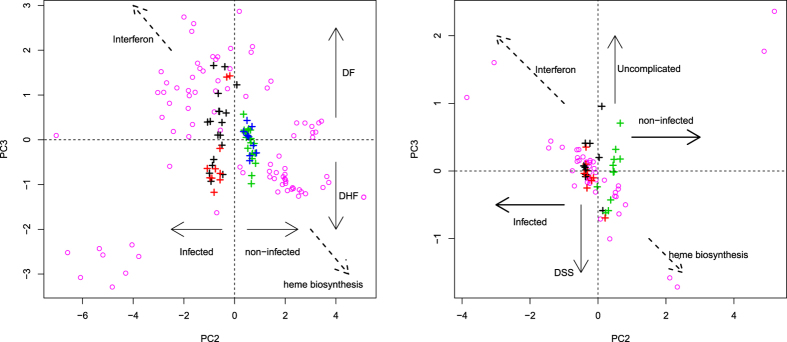
Figure 4. Biplots of PC2 and PC3 scores, u2i and u3i, computed using only the 46 genes selected with PCA-based unsupervised FE.
Left: data set 1 (GSE51808); right: data set 2 (GSE13052). Open magenta circles are PC scores for the probes associated with the 46 genes (for more details on the biological features of individual genes, see the enrichment analysis available in sheets 1–3 in S1_File). The contributions of PC2 and PC3 increased to 13% and 4% (left: data set 1), respectively, and to 7% and 1.6% (right: data set 2), respectively. Black (red) crosses represent PC loadings, v2j and v3j, of the DF (DHF) patients. Blue crosses correspond to healthy controls. Green crosses represent convalescent patients. Broken arrows show the different gene functions (see sheets 1-3 in S1_File). DSS, Dengue shock syndrome.

