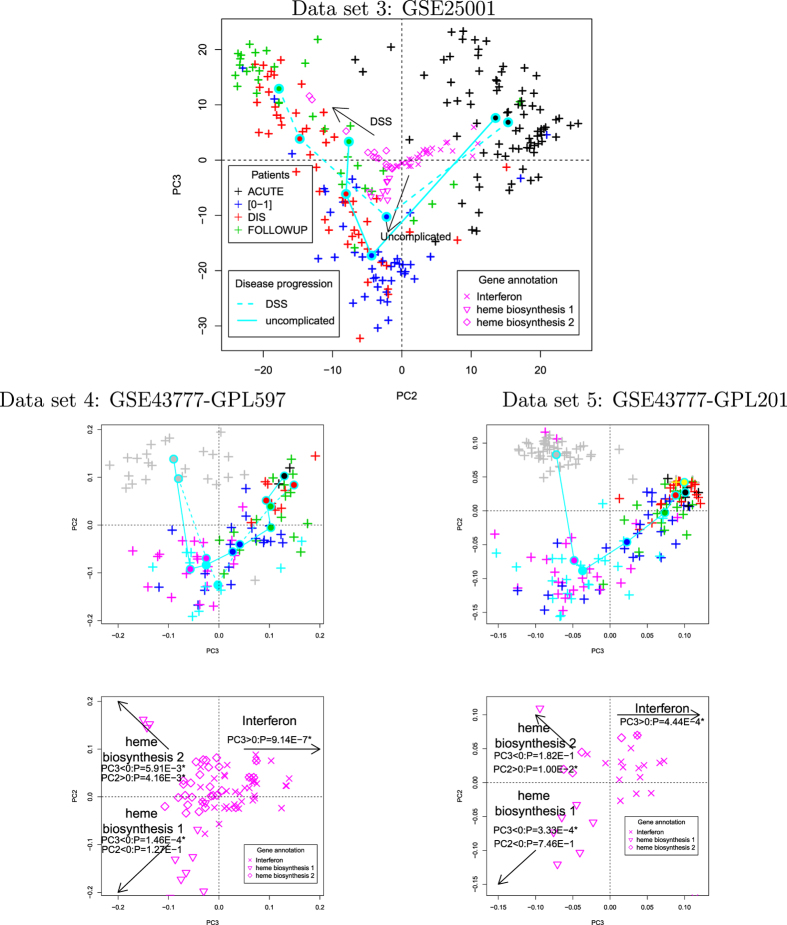
Figure 5. Biplots for data sets 3 to 5.
Top: Biplot of data set 3 (GSE25001) using only the 46 genes identified in data sets 1 and 2. Open magenta symbols ×, ∇, ◇ are the PC scores, u2i and u3i, for the probes associated with the 46 genes (for more details on the biological features of individual genes, see the enrichment analysis available in sheets 1–3 in S1_File). The contributions of PC2 and PC3 increased to 11% and 6.3%, respectively. Crosses (+) represent the PC loadings, v2j and v3j, of the patients. Filled circles connected by solid cyan lines represent the centres of mass for each group (see legends for more details). Middle left: Scatter plot of the PC scores for data set 4 (GSE43777-GPL507) using 76 probes attributed to any of the 46 genes. The contributions of PC2 and PC3 increased to 5.3% and 4.0%, respectively. The correspondence between the coloured crosses (+) and disease progression are black (stage G1), red (stage G2), green (stage G3), blue (stage G4), cyan (stage G5), magenta (stage G6), and grey (stage G7). Cyan solid and broken lines correspond to DF and DHF, respectively. Middle right: Scatter plot of the PC scores in data set 5 (GSE43777-GPL201) using 28 probes attributed to any of the 46 genes. The contributions of PC2 and PC3 increased to 14% and 10.0%, respectively. The correspondence between the coloured + symbols and disease progressions are the same as for GSE43777-GPL507 and yellow (stage G0). Solid cyan line corresponds to patients with either DF or DHF. Bottom: Scatter plots of PC loading (left to right: GSE43777-GPL507/201). P-values were computed with a t test to determine whether the PC scores had positive (or negative) mean values.

