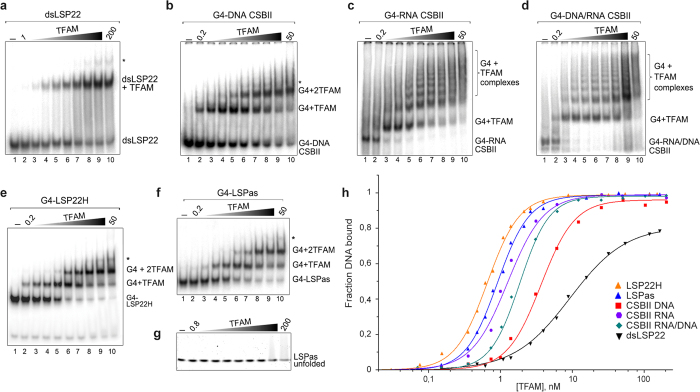
Figure 2. TFAM recognizes DNA and RNA oligonucleotides folded into G4 structures.
(a–g) EMSA of the indicated 32P-labelled substrates (0.5 nM) incubated with increasing concentrations of rTFAM (first and last dilutions, in nM, are indicated for each gel in lane 2 and 10, respectively). In (g), the unfolded LSPas was obtained by alkaline denaturation and neutralization of the G4 before immediate incubation with TFAM. (h) Experimental points from the mobility-shift titrations exemplified in panels a-g for binding quantification and curve fitting using the Hill equation. The fraction of the total DNA bound was used for the G4 substrates. The solid curves result from fitting the data according to Eq. (1). Titration for dsLSP22 was not carried beyond 80% of saturation, because TFAM aggregation occurs at high protein concentration (e.g. >300 nM).

