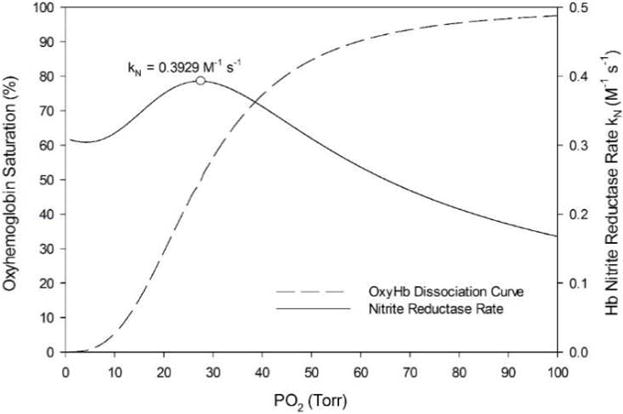
Figure 2.

Oxyhemoglobin saturation curve (dashed line) and nitrite reductase rate (solid line). The saturation curve is characterized by the Hill equation using approximated values for HbA: h = 2.84 and P50 = 27.37 Torr. The maximum kN of 0.3929 M−1 s−1 occurs at blood PO2 = 27.24 Torr (circle).
