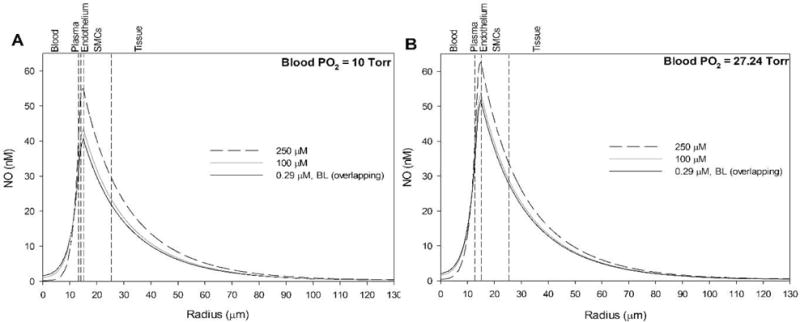
Figure 5.

Effect of blood nitrite infusions on NO profiles with the hypothesized N2O3 pathway. Nitrite is varied from 290 nM (solid black line) to 100 μM (solid grey line) to 250 μM (dashed black line) and compared against baseline (no nitrite, overlapping with solid black line) at blood PO2 values of (A) 10 Torr and (B) 27.24 Torr. The vertical dashed lines mark boundaries between the five radial layers labeled above the graphs. Note that the baseline NO profile (no nitrite, solid black line) is indistinguishable from the low nitrite infusion prediction (290 nM).
