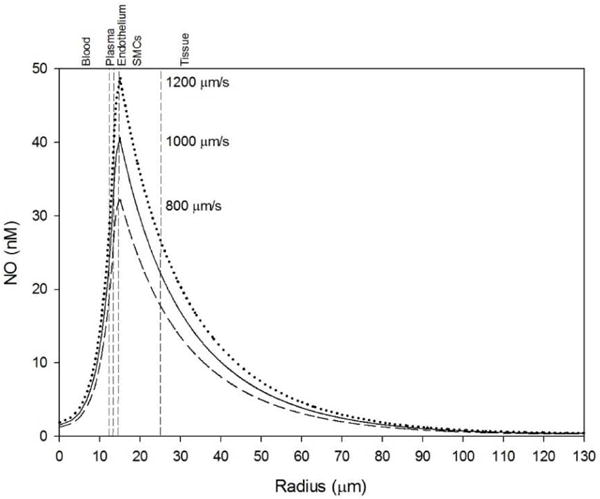
Figure 7.

Effect of blood flow changes on baseline NO profile at blood PO2 = 10 Torr. Low (dashed line), baseline (solid line), and high (dotted line) flow were defined as 800, 1000, and 1200 μm s−1 centerline velocities, respectively. The vertical dashed lines mark boundaries between the five radial layers labeled above the graphs.
