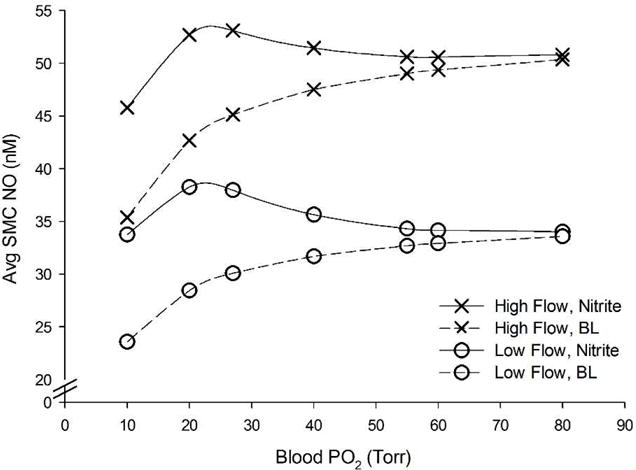
Figure 8.

Effect of flow changes and 250 μM nitrite infusion on average SMC NO concentration compared over a range of blood oxygen levels. Circles and crosses correspond to low (800 um s−1) and high (1200 um s−1) flow, respectively. Dashed lines and solid black lines correspond to no nitrite and 250 μM nitrite, respectively. The baseline flow values fell in between low and high flow rates and are not shown for clarity.
