
Graph 1.
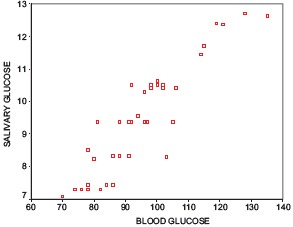
Scatter plot No.1 correlation between random capillary blood glucose and unstimulated whole salivary glucose in control group
Official websites use .gov
A
.gov website belongs to an official
government organization in the United States.
Secure .gov websites use HTTPS
A lock (
) or https:// means you've safely
connected to the .gov website. Share sensitive
information only on official, secure websites.
Scatter plot No.1 correlation between random capillary blood glucose and unstimulated whole salivary glucose in control group