Graph 2.

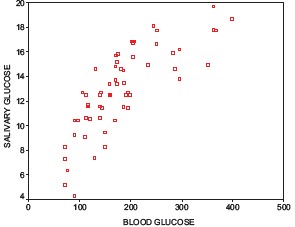
Scatter plot No 2: Correlation between random capillary blood glucose and unstimulated whole salivary glucose in experimental group

Scatter plot No 2: Correlation between random capillary blood glucose and unstimulated whole salivary glucose in experimental group