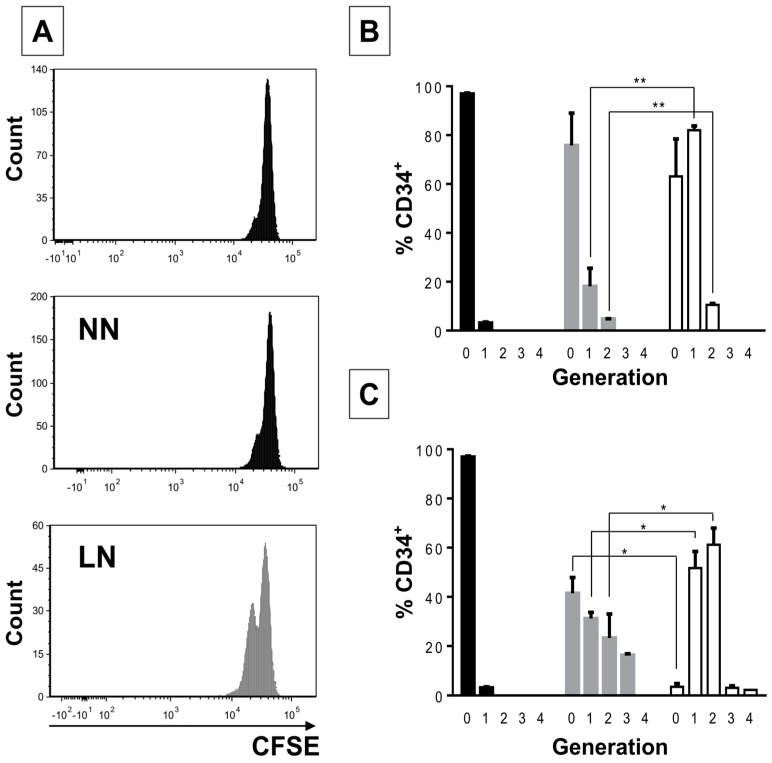
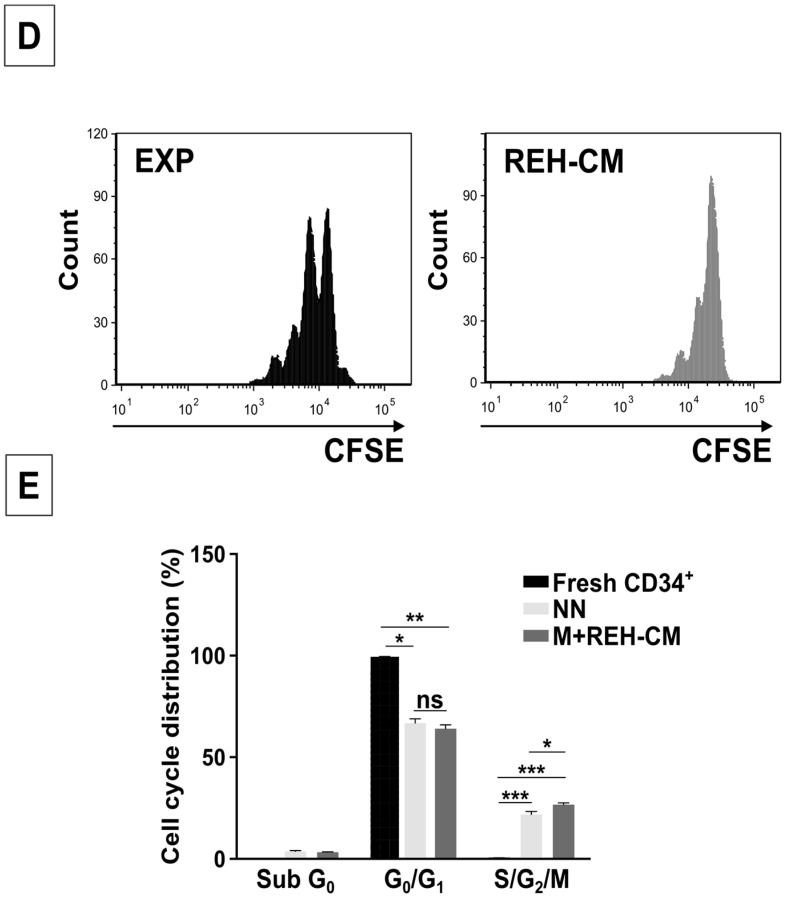
Figure 1.
Increased proliferation capacity of CD34+ cells in the LN. (A) CD34+ cell proliferation in the NN and the LN was determined by cell staining with CFSE after three days of incubation. The histogram in the upper panel shows CD34+ cells synchronized by serum starvation (FBS removal for two days); (B) percentage of CD34+ cells at the corresponding number of cell divisions (0, 1, 2, 3, or 4) in the synchronized cells (black), NN (grey), and the LN (white) after three days of co-culture; (C) Percentage of CD34+ cells at the corresponding number of cell divisions (0, 1, 2, 3, or 4) in the synchronized cells (black), NN (grey) and the LN (white) after six days of co-culture; (D) CD34+ proliferation evaluated by CFSE staining after three days of culture in cell expansion conditions (FLT-3L, TPO, and SCF, all at 50 ng/mL) (EXP) or incubated with the REH-CM (E). Freshly isolated CD34+ or CD34+ from the NN and the M+REH-CM were stained with Hoechst 33342 dye for cell cycle evaluation by flow cytometry (FACSAria™ II, BD Biosciences, San Jose, CA, USA). (ns: non-significant, * p < 0.05, ** p < 0.01, *** p < 0.001). Results shown represent two independent experiments done in duplicates (n = 4).


