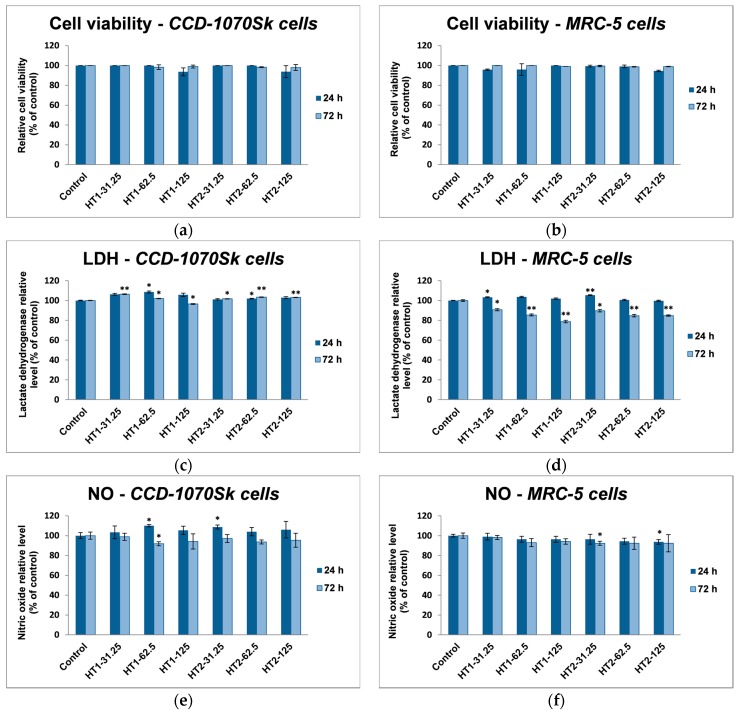
Figure 7.
Biocompatibility of different concentrations (μg/mL) of the two TiO2 NPs samples: TiO2-1% Fe–N NPs co-precipitated at pH 8.5 (HT1) or pH 5.5 (HT2), as shown by cell viability, lactate dehydrogenase (LDH), and nitric oxide (NO) release assays after 24 and 72 h exposure on normal skin (a,c,e) and lung (b,d,f) fibroblasts. Results are expressed as the mean ± standard deviation (SD) (n = 3) and represented relative to the untreated cells (control). * p < 0.05 and ** p < 0.01 compared to control.

