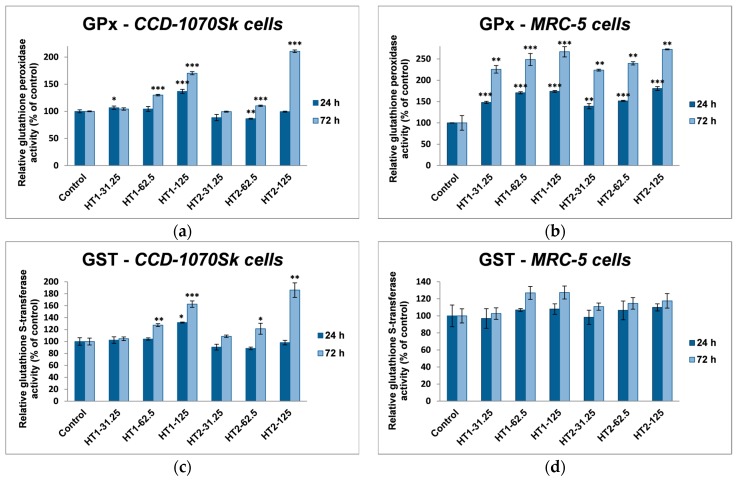
Figure 9.
Glutathione-dependent enzymes’ activities and glutathione level in normal skin (a,c,e) and lung (b,d,f) fibroblasts exposed to different concentrations (31.25, 62.5 and 125 μg/mL) of TiO2-1% Fe–N NPs co-precipitated at pH 8.5 (HT1) or 5.5 (HT2) for 24 and 72 h. Results are expressed as the mean ± standard deviation (SD) (n = 3) and represented relative to the untreated cells (control). * p < 0.05, ** p < 0.01 and *** p < 0.001 compared to control.


