Figure 2.
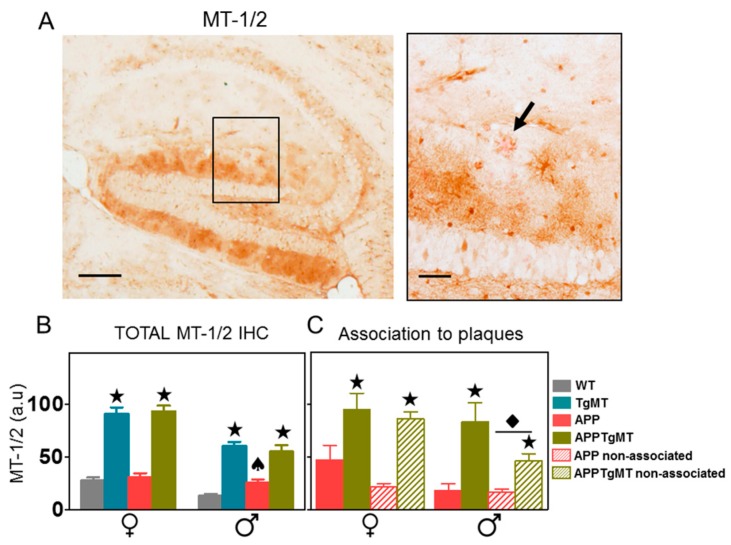
Effect of Mt1 overexpression on MT-1/2 staining in the hippocampus. (A) Representative immunostaining for MT-1/2 counterstained with Congo Red in the hippocampus of APPTgMT mice (left); scale bar: 200 µm. A higher magnification of the black lined square area is shown at the right to better demonstrate plaques stained with Congo Red dye (arrow); scale bar: 50 µm; (B) Quantification of total MT-1/2 immunohistochemistry (IHC) produced similar results to the cortex, with dramatic increases in TgMT and APPTgMT mice (★ p < 0.001 vs. WT or APP mice, respectively). An opposing trend of APP expression was again seen between WT and TgMT male mice (♠ p < 0.05 interaction); (C) Comparison of MT-1/2 levels associated with plaques to those not associated with plaques indicated an increased immunostaining in the vicinity of the amyloid plaques only in male mice (◆ p < 0.05 vs. staining associated to plaques). Results are mean ± SEM (n = 7–11). a.u., arbitrary units.

