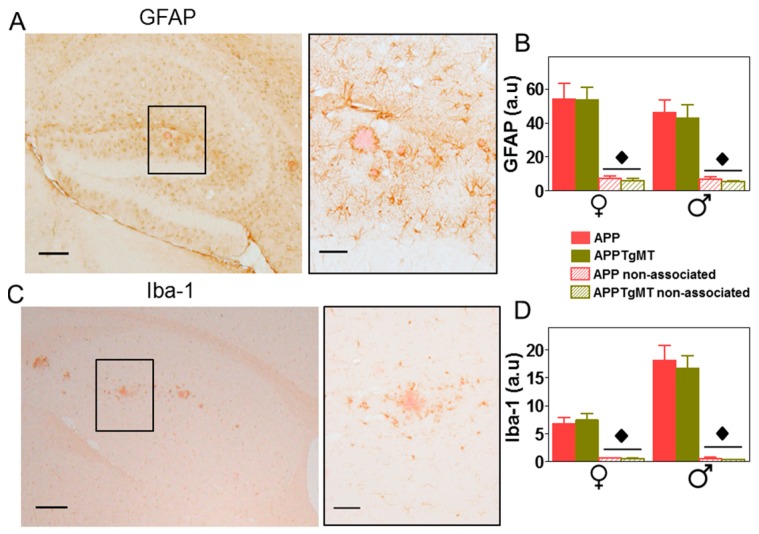
Figure 3.
Effect of Mt1 overexpression on gliosis in the hippocampus. (A,C) Representative immunostaining for GFAP (astrocytes) and Iba-1 (microglia), respectively, counterstained with Congo Red, in the hippocampus of APPTgMT mice (left); scale bar: 200 µm. On the right, a higher magnification of the black lined square area from left panel shows astroglia and microglia surrounding dense plaques; scale bar: 50 µm; (B,D) Quantification of GFAP and Iba-1 IHC indicated a dramatic increase in the vicinity of the plaques. Results are mean ± SEM (n = 11–18); ◆ p < 0.001 vs. plaque-associated staining. a.u., arbitrary units.

