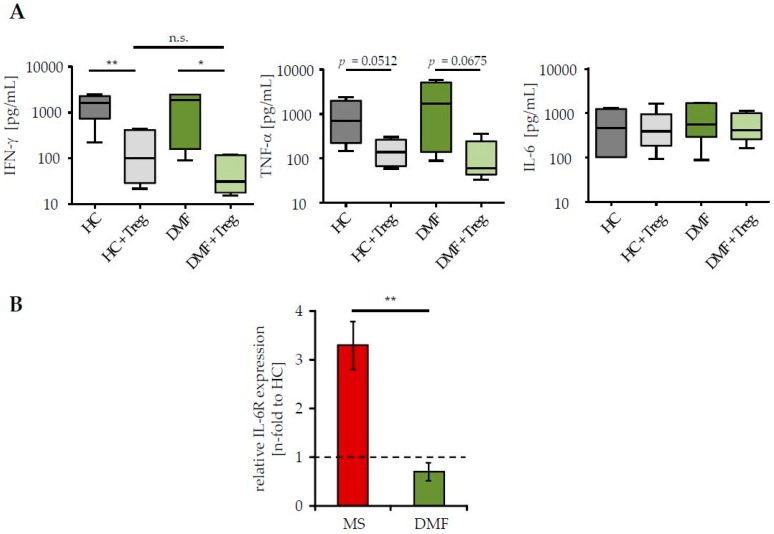
Figure 2.
DMF therapy normalized interleukin-6R (IL-6R) expression on T cells of MS patients. (A) Supernatants of polyclonal activated PBMC (0.5 µg/mL anti-CD3 mAb, stimulation in presence/absence of Treg, ratio 1:1) were collected at day three and cytokine profiles were analyzed. Data represent pooled results of six donors per group (therapy-naïve red, after DMF therapy green) or HC (grey). Median and interquartile ranges are depicted, p-values relative to PBMC cocultured with Treg are shown * p < 0.05, ** p < 0.01, n.s. = not significant; (B) IL-6R expression on CD3+ T cells from therapy-naïve (red) or DMF-treated (green) patients was determined by flow cytometry. Data display fold change in IL-6R expression to HC (black dashed line), p-value relative to IL-6R expression of therapy-naive MS patients ** p < 0.01 is shown.

