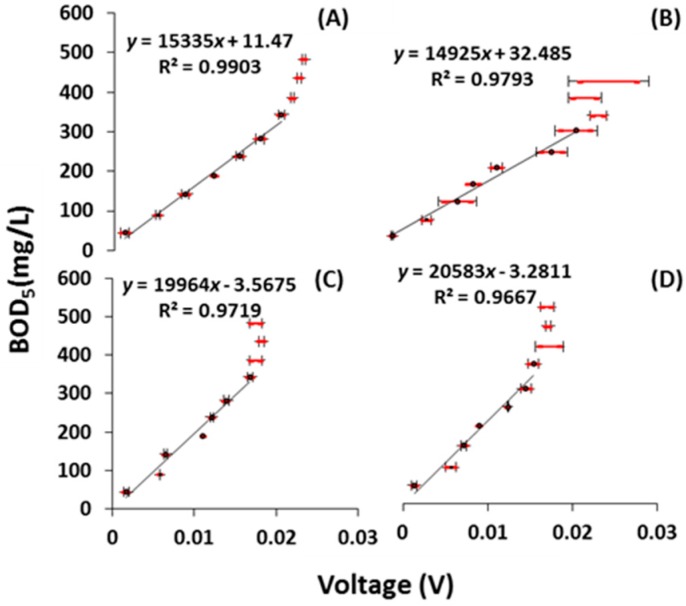
Figure 2.
Dynamic response of the MFC BOD sensors against organic concentration (BOD5) in sodium acetate solution at different time intervals. (A,B) show a linear relationship between maximum steady-state voltage generated and BOD5 of the β- and γ-MnO2-type MFC BOD biosensors, respectively, after 3 months; (C,D) demonstrate the same type of linear relationship after 1 year. Standard deviations in voltages are indicated in red color.

