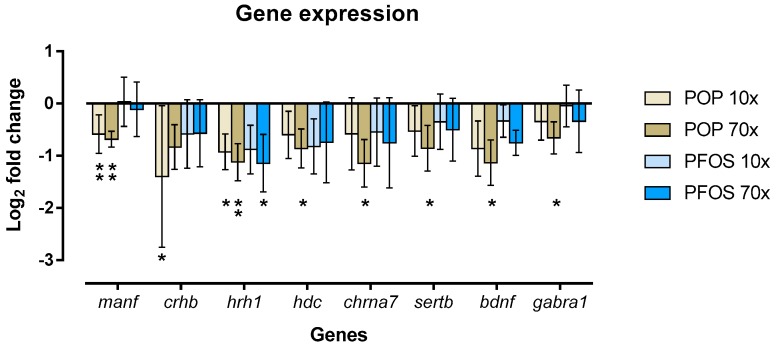
Figure 3.
Transcription levels in genes relevant to behaviour following POP mixture and PFOS exposure. The line at zero indicates the gene expression in control groups (DMSO 0.05%). Data are presented as mean ± SD relative to control. An asterisk identifies genes expression levels that were significantly different from the solvent control (one-way ANOVA test, * = p < 0.05, ** = p < 0.005).

